By Jay Jacobowitz and Maggie Jaqua
Sponsored by: Nutrasource
For 45 years, WholeFoods Magazine has been conducting this survey, but we changed things up slightly during the upheaval of the pandemic by starting our questionnaire with a simple yet significant request: Please tell us anything that is on your mind about your business. The responses help industry members see beyond the numbers and hear from independent retailers, in their own words, on the state of business. And for the brands, suppliers, distributors: Retailers are sharing how you can help support the brick-and-mortar stores that have long been the backbone of this industry.
Business post-COVID, one retailer told us, is not as usual. “However, we are continuing to keep our customers healthy and happy.” Another outlined issues that were echoed by many: “Running an independent store has become more challenging since COVID. Out of stocks, limited supplies, a lack of qualified candidates for employees, increased overhead costs, increases in the cost of goods, and inflation limiting consumer discretionary income (and probably more issues than this) make for difficult times.” Given all that, another respondent stressed, “[You] have to love what you are doing to be in this industry, or you should do something else for a living.”
Important background to keep in mind regarding the survey results: The annual survey is like sampling a glass of vintage cabernet sauvignon. Each year, we taste from a different vineyard—the different group of respondents that participates in the survey each year. We also ask each year’s group of respondents to tell us about their own prior year’s results—like sampling two vintages from the same vineyard. This yields our same-store results.
Now, let’s answer the major question: How did respondents fare in the 12-month survey period ending June 2022? Overall, this year’s vintage of stores turned in stronger net profits, averaging 4.8% bottom lines compared to a slimmer 3.05% last year. We’ll dive deeper into the various impacts over the course of this survey.
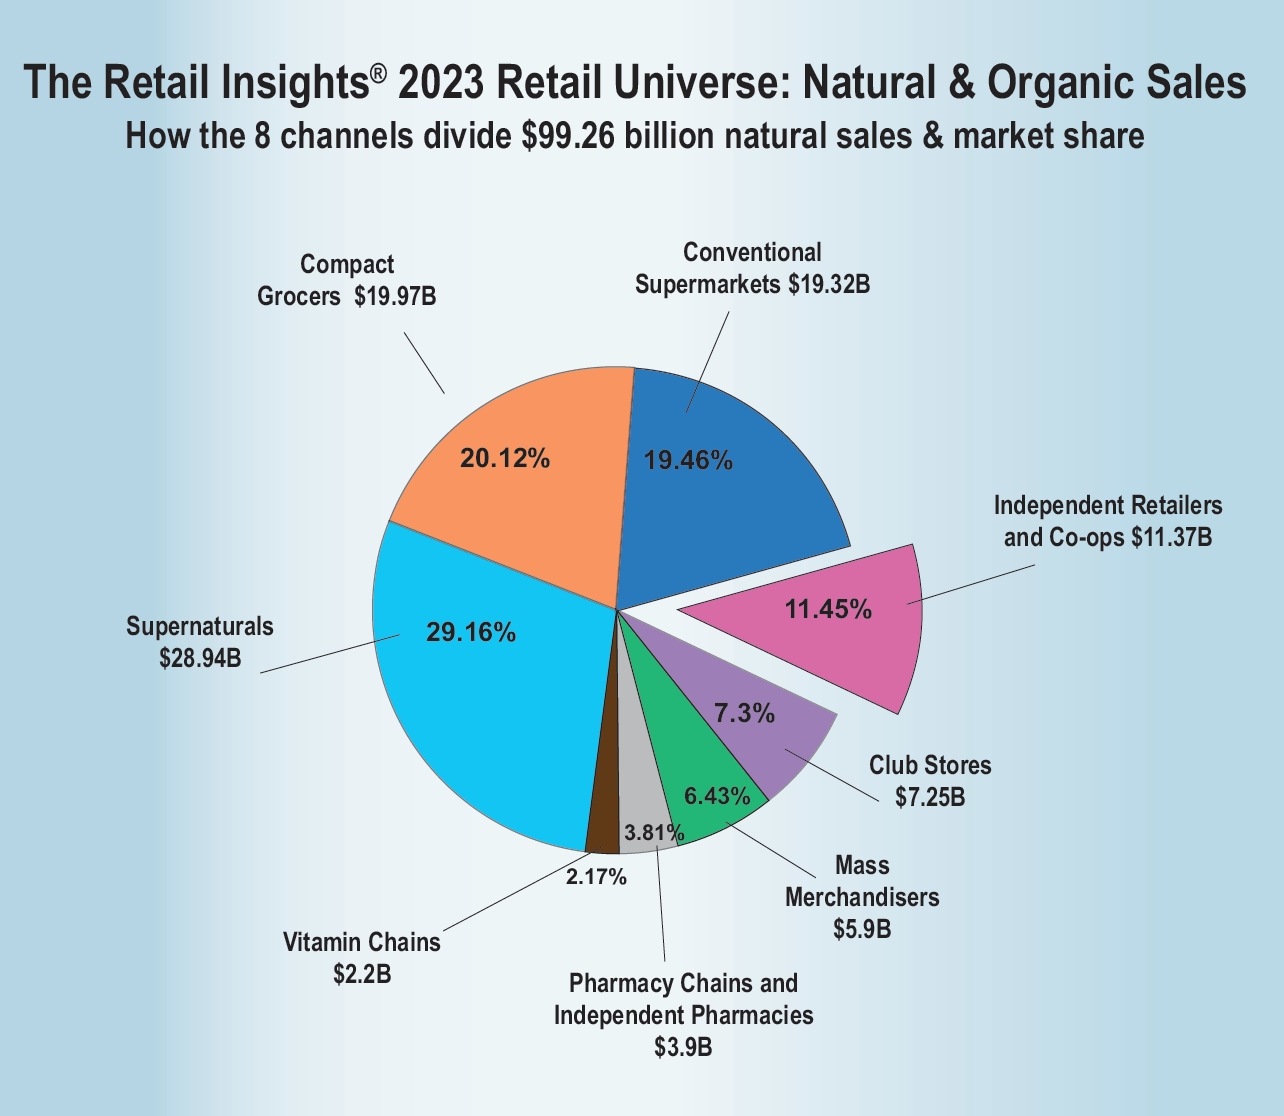
Taking a wider view of our industry, sales from all U.S. independent natural retailers hit $11.36 billion in 2022. Zooming out further, total natural organic sales through all eight retail and food-store channels (including supernaturals such as Amazon Whole Foods Market and Sprouts Farmers Market; conventional supermarkets; mass merchandisers; pharmacies; and vitamin chain stores) was $99.26 billion in 2022 (see below). For a complete update of the U.S. natural organic retail market, see the Retail Insights® 2023 Retail Universe for U.S. Premium Natural, Organic Food, Supplement & Personal Care Sales.
Now, let’s explore the detailed findings that can help you see how your store stacks up, and provide you with insights that can help you strengthen your business. We’ll be discussing key findings and answering your questions in a virtual presentation, which, along with this year’s survey, is sponsored by Nutrasource Pharmaceutical and Nutraceutical Services. Stay tuned for details! Questions? Send them to editor@wfcinc.com and we will address them in the webinar.
Respondents at a Glance: Uncorking this year’s “vintage”
As we have done for 45 years, WholeFoods Magazine surveyed independent natural organic retailers. We partnered with Readex Research to gather results for the 12 months ending June 2022. Our thanks to the retailers who participated. Your input helps us deliver what we believe is the most accurate picture of independent natural products retailing in the U.S. today, used by natural products retailers to measure and improve business, and by industry partners to better understand and support their retail partners.
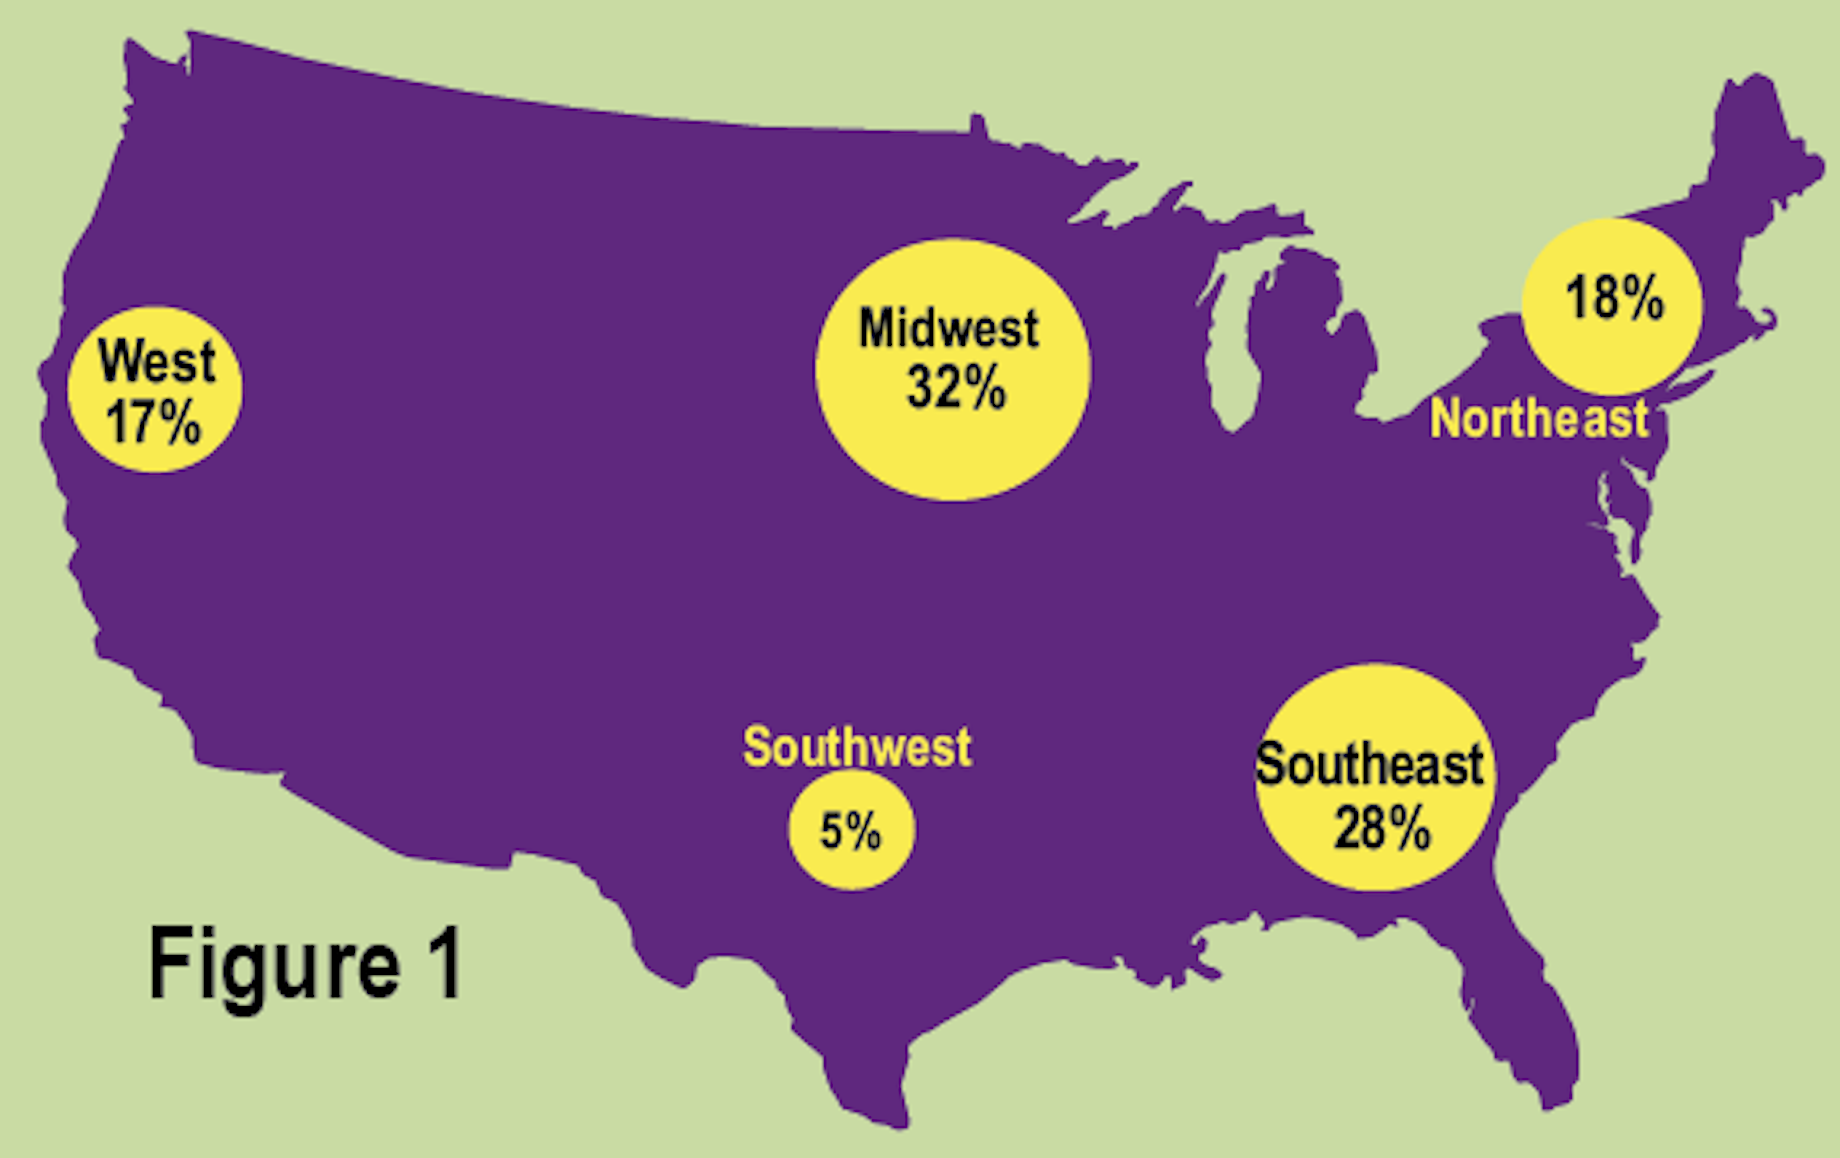
Respondents to this survey are owners/CEOs (66%), general or store managers (21%) and team leaders (13%). Respondents have owned their stores for an average of 26 years, and stores in the survey have been in business for an average of 34 years under all ownership. The oldest store in our survey has been operating for 108 years! Our retailers come from every region (see figure 1), and represent every size market (see below), giving us an in-depth picture of the industry.
Market size:
41% Large town or rural area (population less than 50,000)
26% Medium city or suburb (population 100,000 – 299,999)
13% Major metropolitan area (population 1,000,000+)
13% Small city (population 50,000 – 99,999)
7% Large city or suburb (population 300,000 – 999,999)
Store types:
74% are natural products/health food stores, natural products co-ops,
nutrition/herb stores, or natural pharmacies
12% are retailing natural practitioners or doctors carrying nutritional
supplement inventory
9% are natural pet products stores, kitchen and home goods stores, gyms, or prepared foods/restaurants
4% are natural products supermarkets
1% are independent conventional supermarkets offering significant natural/organic assortment
Units and leases:
75% operate 1 store; 13% operate 2-6 stores; 7% operate 7+ stores
5% internet only
56% rent their space; 44% own the real estate
Perishables Percentages Range by Group
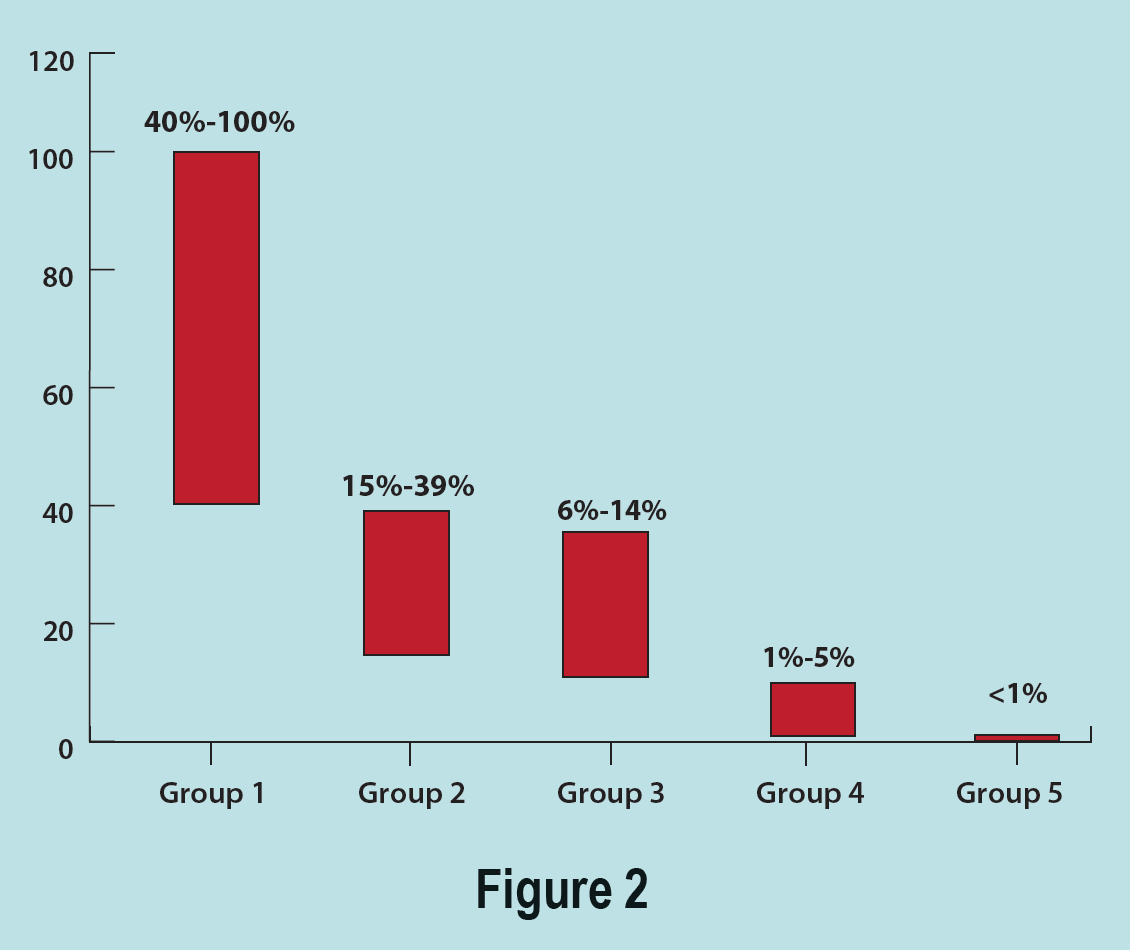
Each year, we organize the survey according to the percentage of fresh perishables a store sells. More than any other single variable, fresh foods largely determine the physical size of the store, its customer counts, and total sales. We divide survey respondents into five groups, with Group 1 generating the highest percentage of sales from perishables, and Group 5 generating the least (see figure 2). A store in Group 5, which sells no perishables, looks nothing like a store in Group 1, which offers a wide selection of perishables (think a Whole Foods Market). When using the data from this survey, compare your results to the results of stores in your group. Which group are you? Find out in three steps:
Step 1: Tally up your sales from four main perishable fresh-foods departments: refrigerated, frozen, produce and prepared foods.
Step 2: Calculate what percentage of your total sales these four categories represent.
Step 3: Compare your results to similar stores in your corresponding Group—either 1, 2, 3, 4, or 5.
Our 2023 Vintage of Respondents
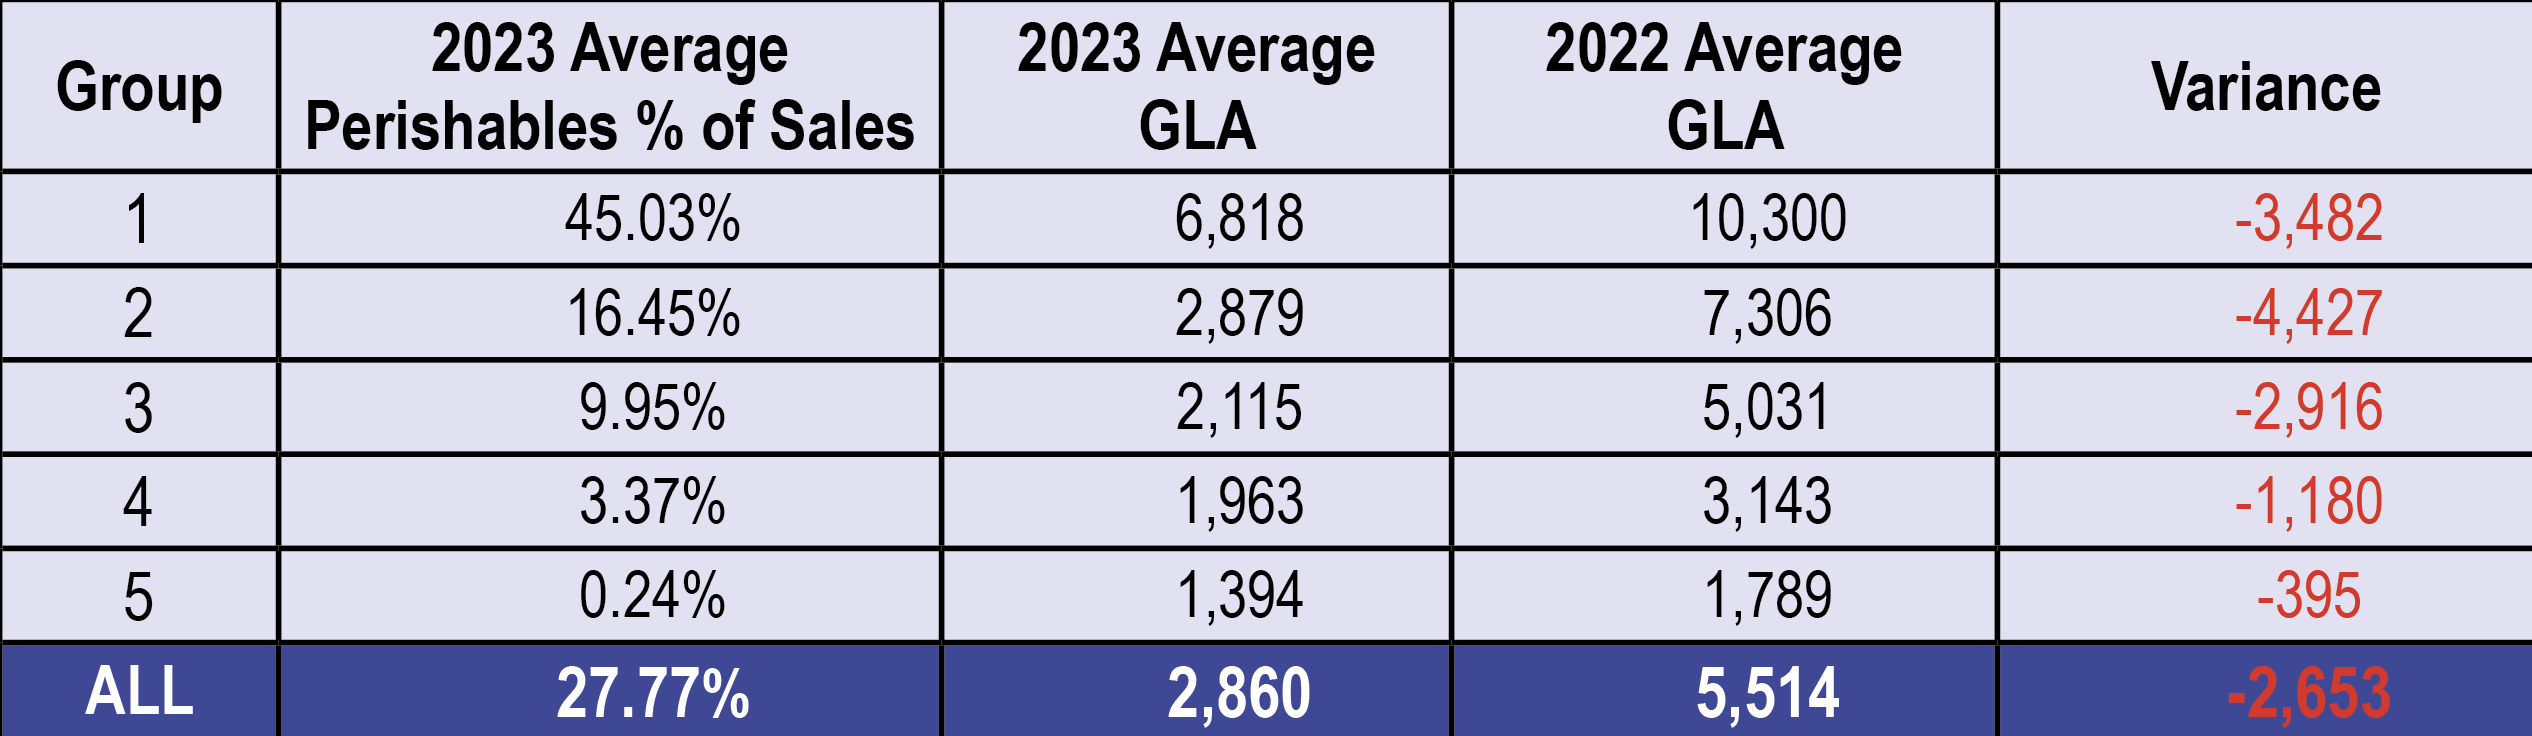
A key to know with this survey: While 40% more stores responded this year, our 2023 vintage of stores averaged smaller footprints than last year. (GLA = gross lease area.)
Fresh Perishables Define the Store
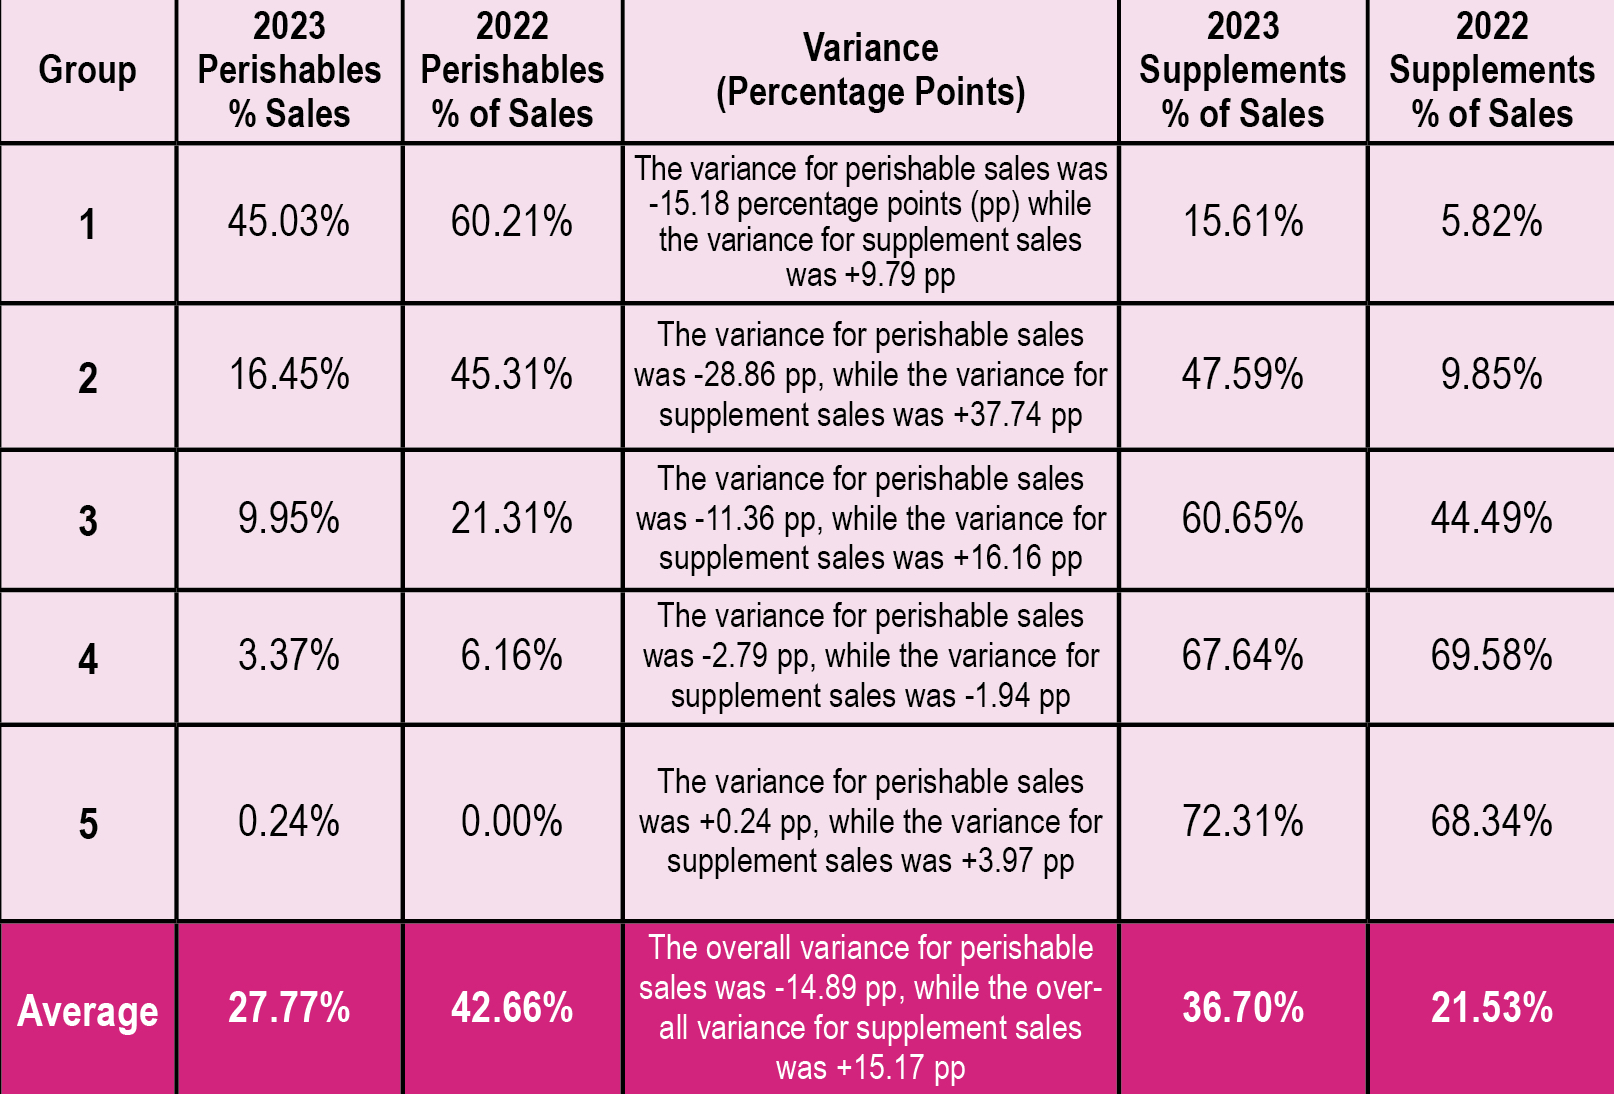
The finding that perishables determine a store’s size and sales remains constant year after year. As you might imagine, stores with smaller footprints don’t have as much room for perishables produce cases, walk-in coolers, freezers, or for deli, bakery, and grab-and-go refrigeration. Overall, this year’s vintage of survey respondents averaged 27.77% of sales from perishables, which is significantly less than last year’s larger-store vintage, which averaged 42.66% perishables. The largest downshift in perishables percentages between this year’s vintage and last year’s was in Group 2, which averaged 16.54% of sales this year vs. 45.31% last year. Group 5 sold 0.24% in perishables, reflecting certain supplements that require refrigeration, such as probiotics, some seeds, and oils. All five groups maintained or increased sales of vitamins and supplements as a percentage of sales (see figure 4).
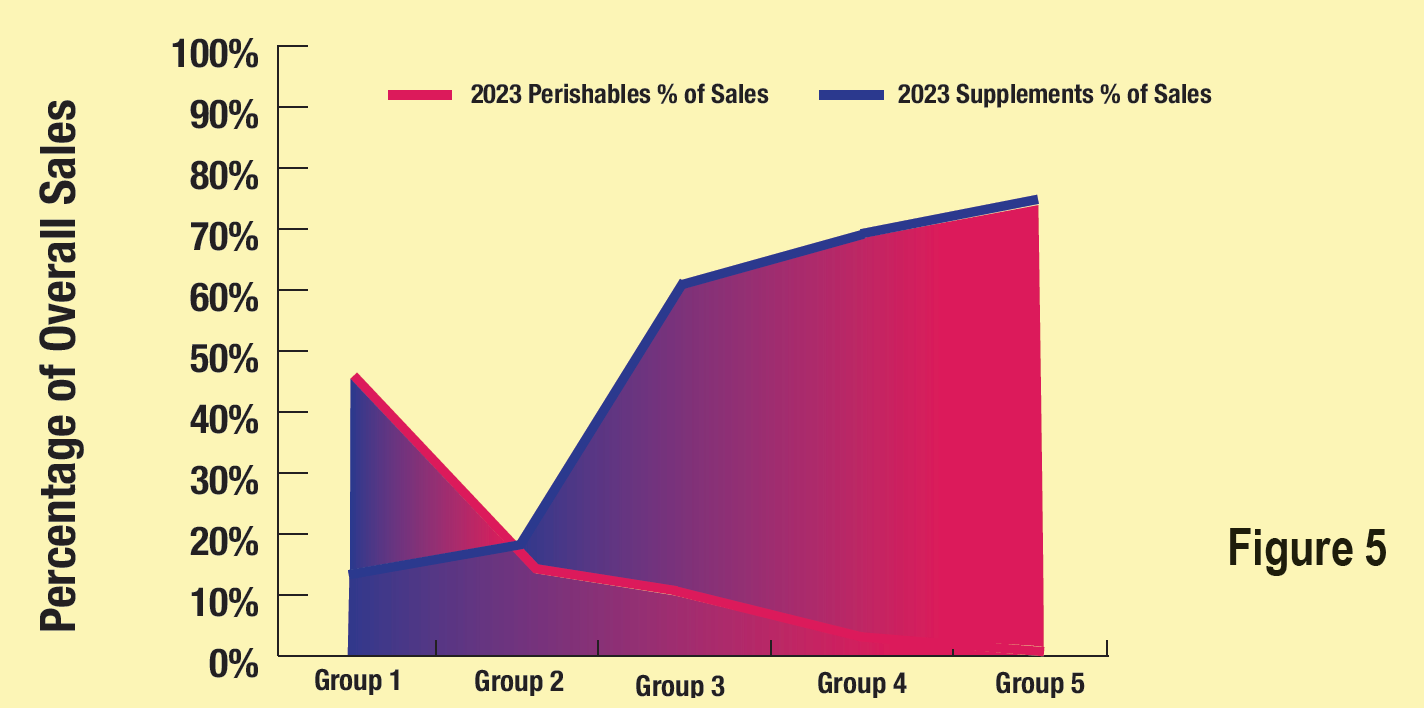
As you’d expect, smaller stores with less room for perishables sell more vitamins and supplements as a percentage of sales (see figure 5). Overall, the survey’s 2023 respondents averaged 36.70% of sales from supplements, up from 21.53% in last year’s vintage, for a 70% increase.
Annual Sales Per Gross Lease Area (GLA) SF and Retail Area SF
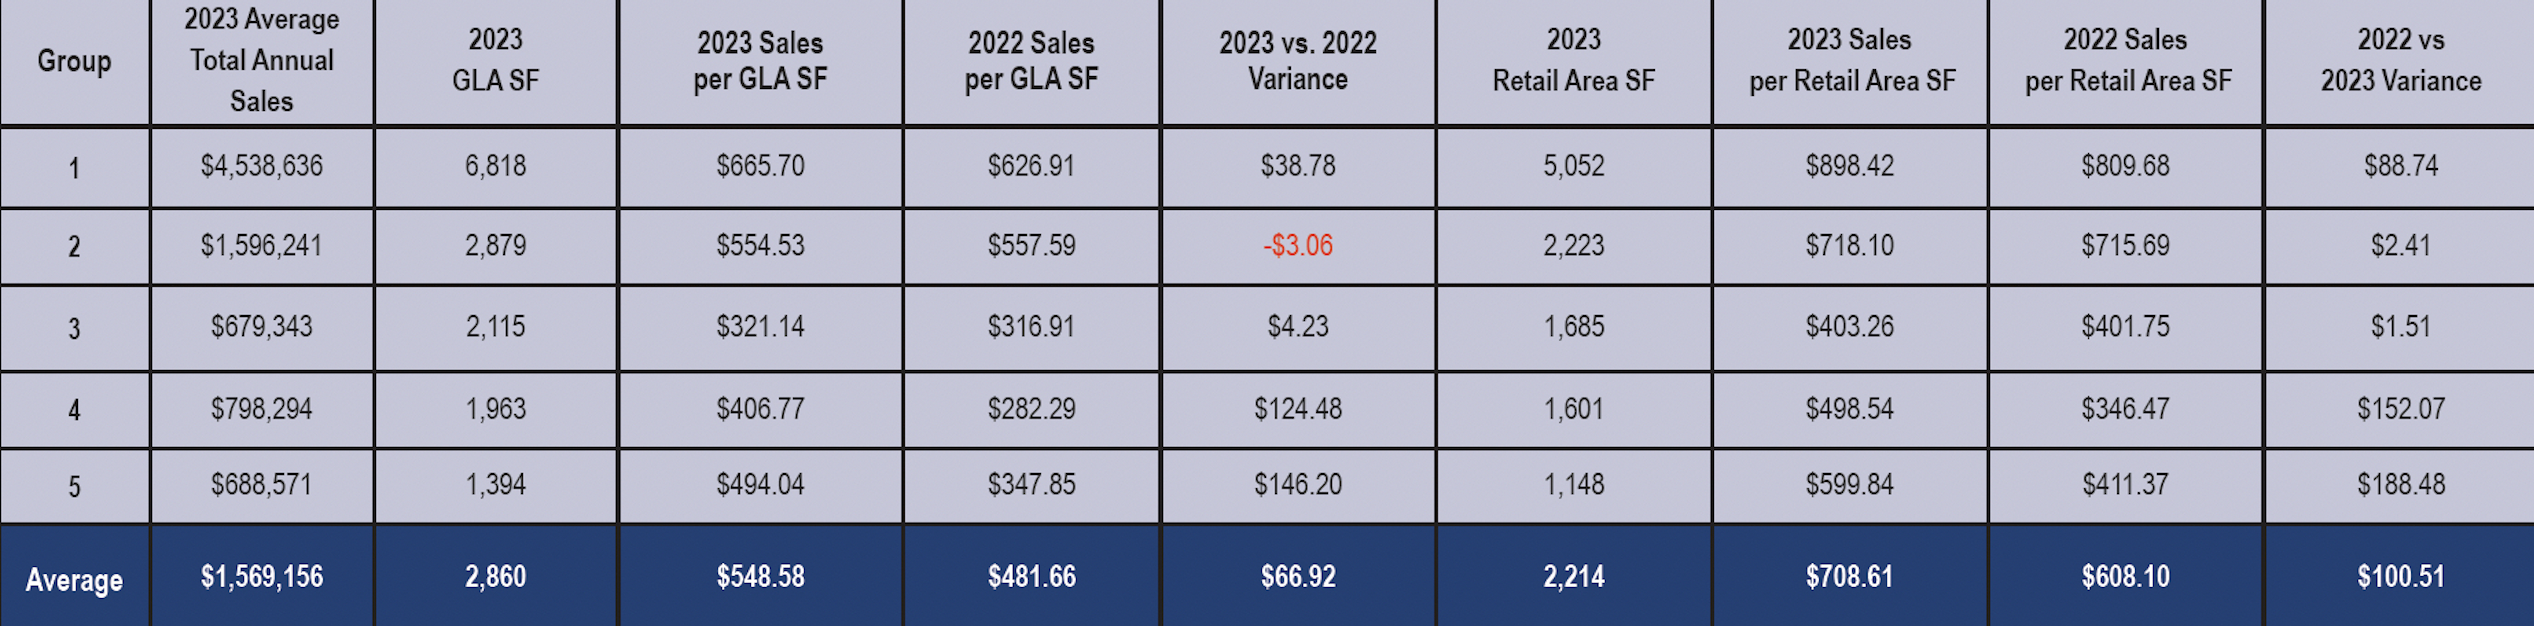
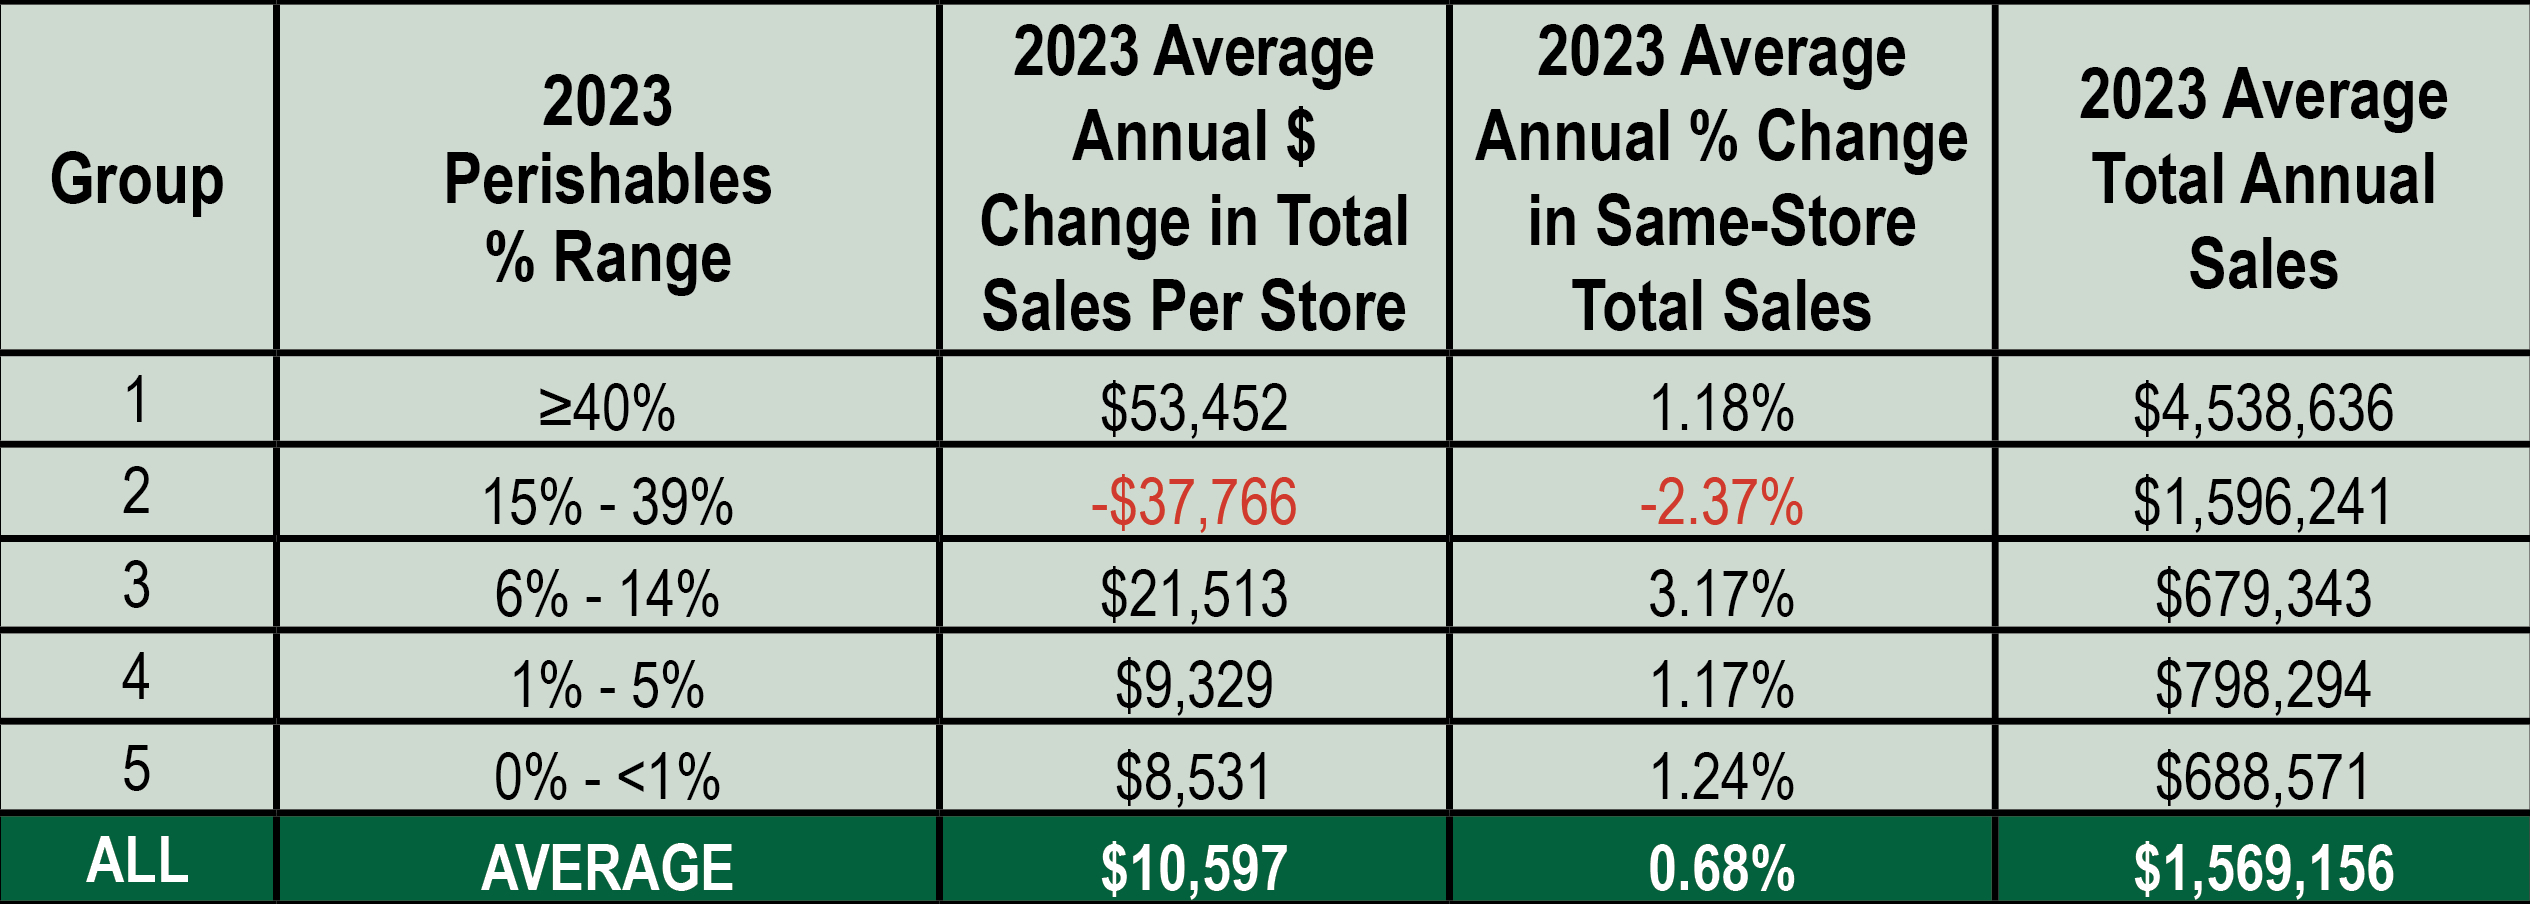
As we have seen every year in the survey, as the percentage of sales from perishables rises, so do total sales. Stores in this year’s Group 1 vintage averaged $4.5 million in total sales, followed by Group 2, at $1.59 million. Groups 3, 4, and 5 clustered in the range of $700,000. The overall average total annual sales for all stores in the survey was $1,569,156.
Annual sales per GLA square foot (SF) held up this year compared to stores in last year’s vintage, with all groups exceeding the prior year’s per-square-foot annual sales except stores in Group 2.
Annual sales per retail-area square foot almost reached $900.00 ($898.42) this year in Group 1, and nearly $600.00 ($599.84) in Group 5, both significantly higher than for these two groups last year. Annual sales per retail-area square foot this year were also significantly higher than last year in Group 4, and were nearly identical compared to last year for Groups 2 and 3.
Pro Forma Profit & Loss
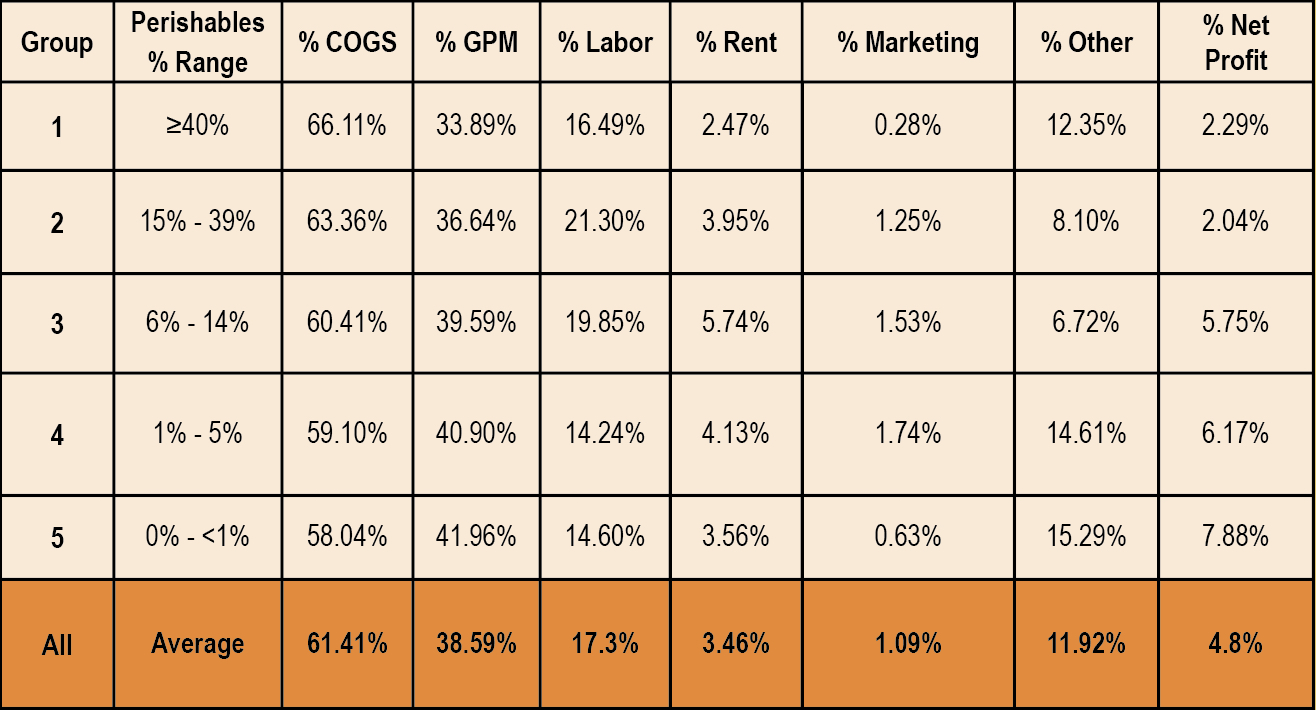
Cost of goods (COGS) decreased, and gross profit margins (GPM) and net profits increased, compared to last year’s vintage of stores. COGS declined to 61.41% from 63.99% last year, GPM increased to 38.59% from 36.01% in last year’s vintage of stores. Net profits rose this year to 4.8%, a significant increase from 3.05% for last year’s vintage of stores. The vitamin and supplement-focused stores in Groups 3, 4, and 5 had the fattest profits, at 5.75%, 6.17%, and a robust 7.88%, respectively. Food-focused stores in Groups 1 and 2 saw significantly slimmer net profits, at 2.29% and 2.04%, respectively.
Year-Over-Year Average Annual Change in Same-Store Sales Per Store
Respondents tell us how their results this year compared to their results last year.
Four of the five groups managed to grow in the 12 months ended June 30, 2022. Gains were between 1.17% and 1.24% in Groups 1, 4, and 5, and a gain of 3.17% for stores in Group 3. Only Group 2 reported a sales decline, edging down -2.37%. Overall for all stores in the survey, annual growth was 0.68%, or an average of $10,597 per store. (See figure 8.)
 Shopping and Spending
One of the most striking findings this year is the increase in average basket size, which rose from $38.57 last year to $47.88 this year (a 24.1% increase), primarily due to the spike in food inflation. Another surprise was the shrinking gap between the lowest and highest average basket size in the five groups, which decreased this year to $4.80, from $7.75 last year. We believe this year’s basket size compression is due to the shrinking gap in GLA between Groups. Last year the G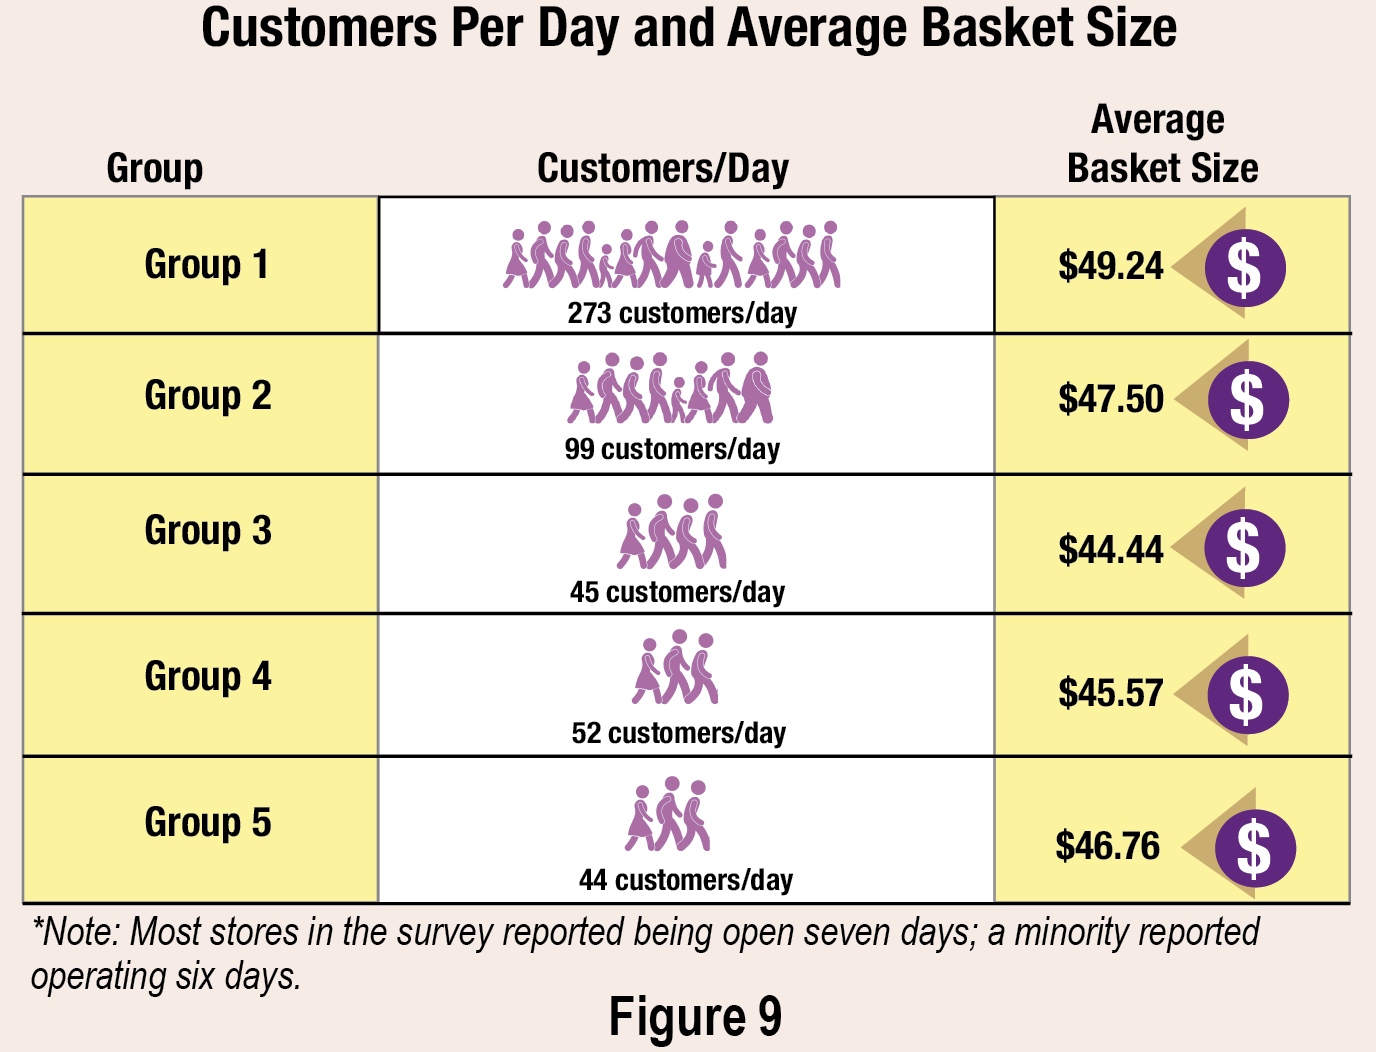 LA gap was 9,400 square feet between the smallest 1,100-square-foot stores and the largest 10,500-square-foot stores. This year, the gap was about half that, at 5,400 square feet GLA, between the 1,394-square-foot Group 5 stores and the 6,818-square-foot Group 1 stores.
What’s in demand at independent natural products stores? In the supplement category, retailers pointed to immune-support products as the top sales drivers. CBD and NAC got multiple mentions as well. Also trending: pet supplements. And in the grocery aisle, mushroom-based products and plant-based got special mentions.
Options for Shopping & Delivery
With COVID restrictions eased, all survey respondents with brick-and-mortar retail stores had in-person, in-store shopping. Delivery remains popular as well.

2023 Cost of Goods, Gross Profit Margin, and Inventory
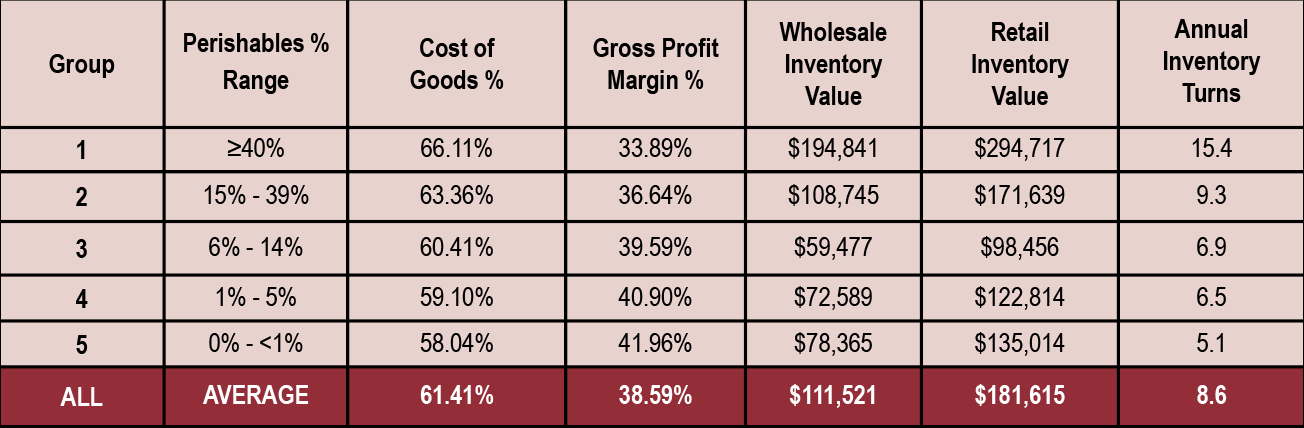
In an unexpected finding, cost of goods (COGS) decreased and gross profit margins (GPM) increased compared to last year’s vintage. COGS declined to 61.41% from 63.99% last year, and GPM increased to 38.59% from 36.01% in last year’s vintage of stores. Three factors appear to contribute to lower cost of goods:
- Aggressive promotional activity by wholesale suppliers and brands attempting to maintain market share as the country exited the pandemic.
- Fewer large fresh-foods-oriented stores, along with more vitamin- and supplement-focused stores in this year’s vintage of stores, meant relatively higher GPMs this year overall.
- Shopper expectations for inflated food prices allowed retailers to fully pass on increased costs, and to perhaps capture more incremental profit margin in the process.
Another finding: With more vitamin-focused stores and fewer large fresh-foods stores in this year’s survey, annual inventory turns slowed, reflecting more shelf-stable products and fewer fresh perishables. Last year, Groups 1, 2, and 3 carried a minimum of 20% fresh perishables. This year, stores in Group 3 got as little as 6% of sales from perishables.
Investing in Employees
Stores in Group 1 this year did a good job controlling labor costs, keeping them at 16.49% compared to last year’s vintage at 19.73%. Labor costs for Groups 2 and 3 were similar to last year as a percentage of sales, ranging between 19% and 22%. Stores in Groups 4 and 5, our vitamin and supplement-focused stores, did significantly better this year with labor costs, which were 14.24% and 14.60%, respectively, compared to 17.29% and 16.87%, respectively, last year. We believe stores in Groups 4 and 5—with smaller, more efficient stores focused on vitamins and supplements—benefited from higher average basket sizes that made it more efficient to generate sales.
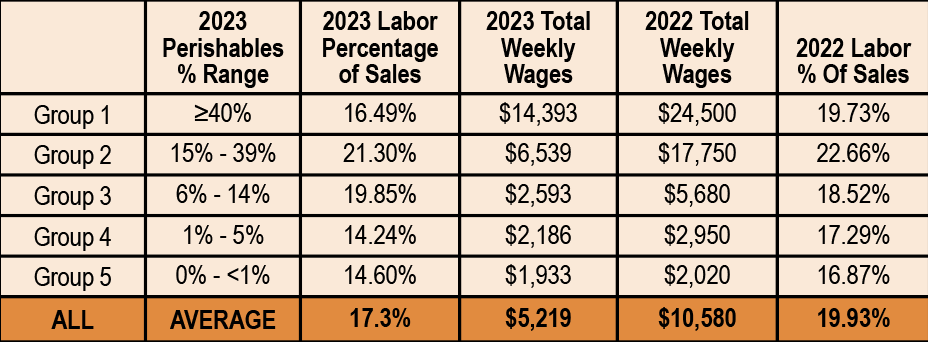
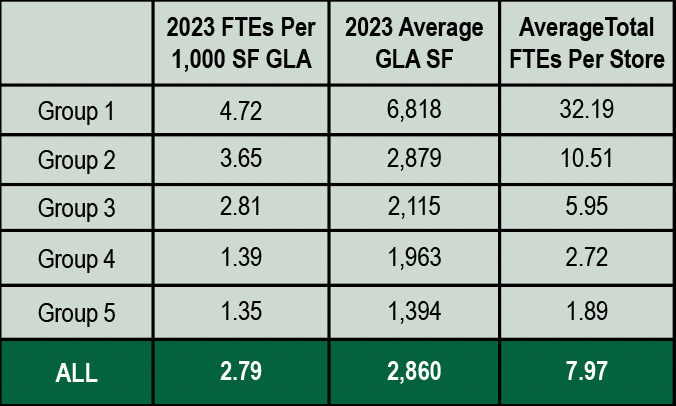
Full-Time-Equivalent Employees Per 1,000 SF GLA
It took nearly five (4.72) full-time-equivalent* employees (FTE) per 1,000 square feet to operate our largest fresh-foods perishables stores in Group 1. The 2,879-square-foot stores in Group 2 needed nearly four (3.65) FTEs per 1,000 square feet to operate. Stores in Group 3 took nearly three (2.81) FTEs per 1,000 square feet to operate. Stores with the least fresh perishables and the most vitamins and supplements (Groups 4 and 5), needed slightly more than one person. It took more than 30 (32.19) FTE employees to run the largest fresh-perishables stores, down to 1.89 FTEs for the smallest stores.
*Full-time equivalence based on a 35-hour work week.
Outreach & Education
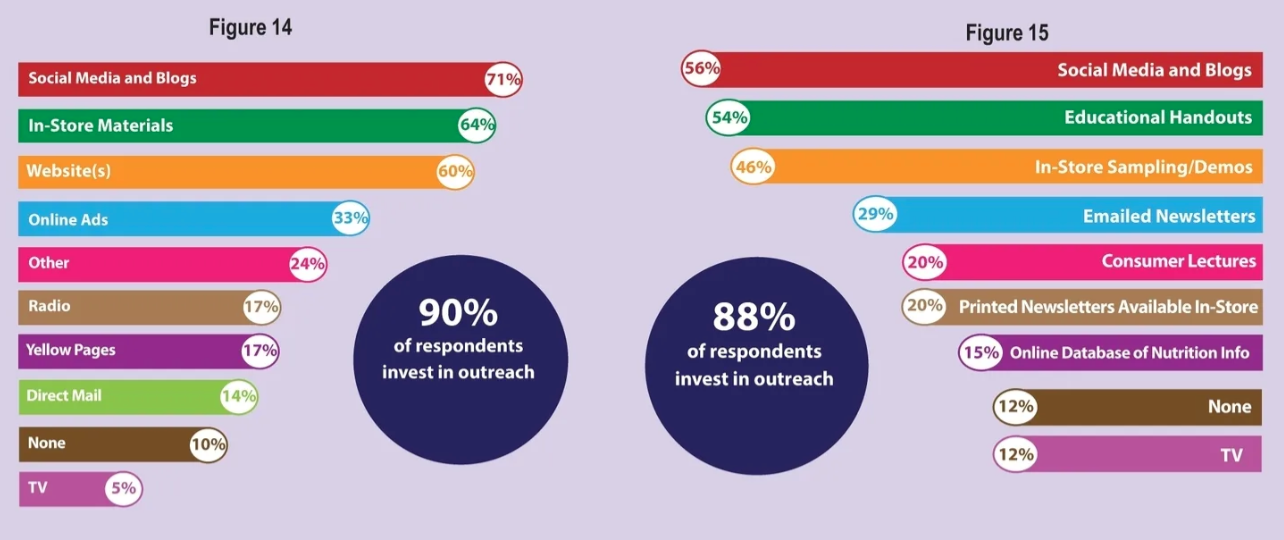
This year’s respondents have fully embraced social media to communicate with customers and prospects, with 71% citing it as a means of advertising and promotion. Nearly two-thirds of respondents (64%) provide in-store materials such as lectures, handouts, sampling, and store newsletters, to inform customers and promote their stores. A majority (60%) have website(s)—lower than we would expect, since this means 40% don’t have a website; rather surprising in today’s digital world. Since more stores participate in social media than have a website, this suggests those without a website depend instead on social media to get the word out. A few respondents (5%) buy TV advertising, likely in secondary markets with relatively affordable TV ad rates. Almost one-quarter (24%) of respondents use some other means of promoting their stores. These included billboards, email, magazines, and newspapers; discount book coupons, outdoor product signs, and football calendars. Sponsorships of local organizations, monthly flyers, price and selection, and the evergreen word-of-mouth, were also popular promotional methods. Not everyone is making an effort here, though: 10% of respondents reported that they do not do anything to promote their stores.
Merchandising
Over half of survey respondents in this year’s retailer survey (56%) reported that they have used social media and/or blogs as a merchandising method. This is followed by 54% of respondents that used educational handouts. Just under half (46%) of this year’s vintage of stores said they offered their customers in-store sampling and product demonstrations. Of the 12% of respondents who told us they used some other merchandising method, these included flyers, ads in local community magazines, and responding to customer requests for certain products and prices. A final 12% reported that they didn’t use any method to merchandise their stores.
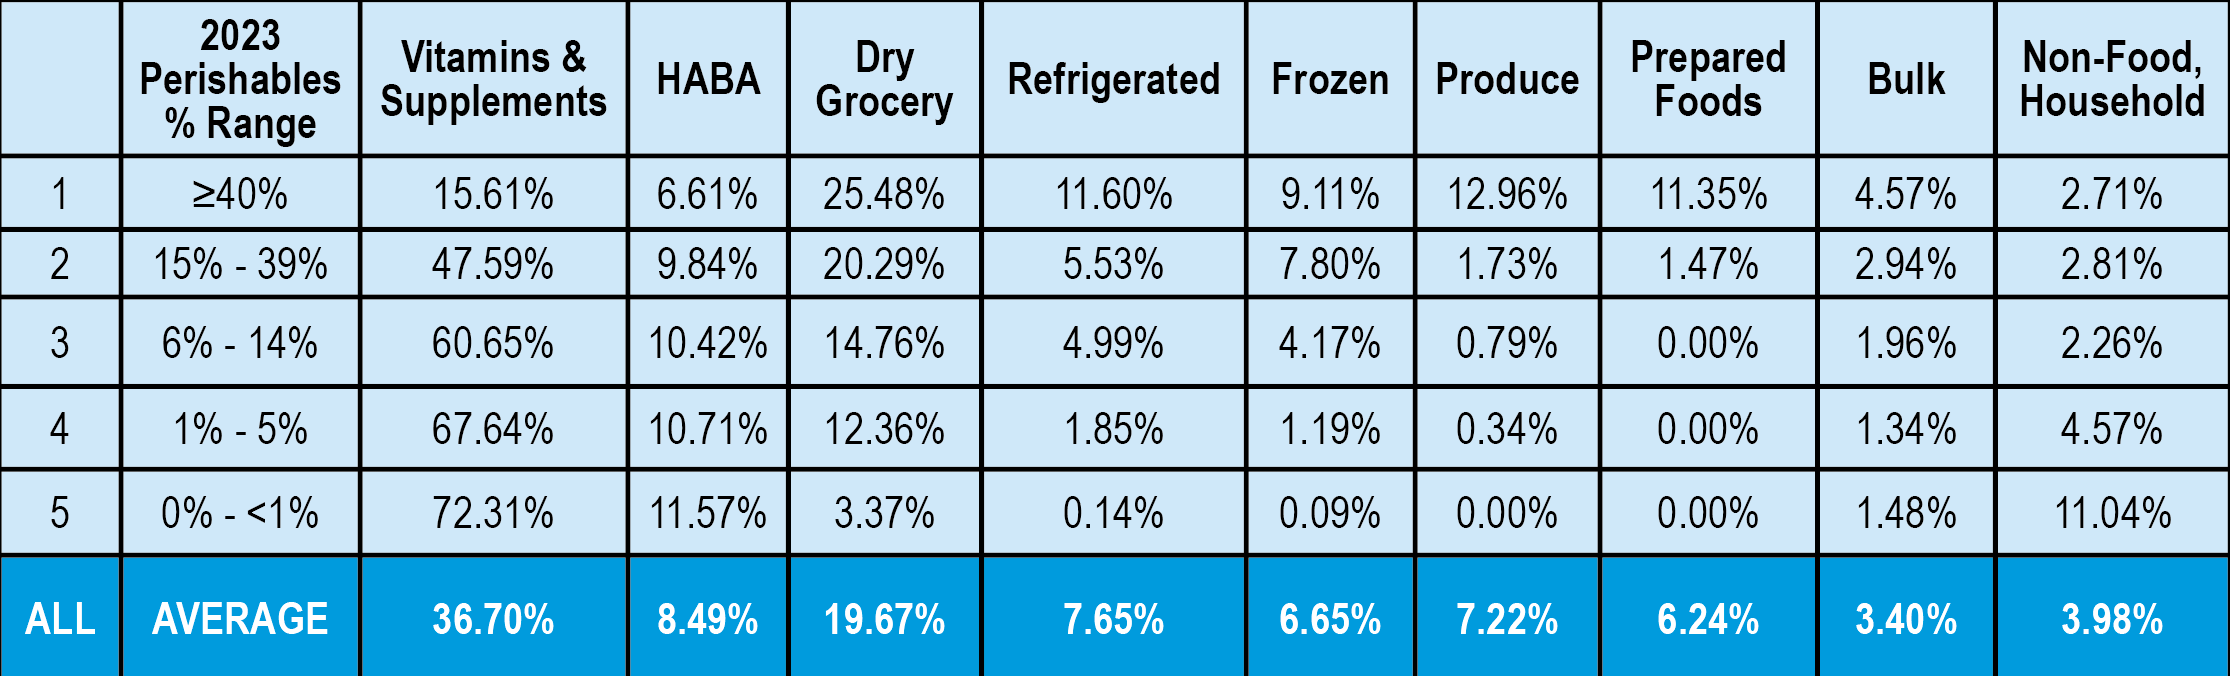
2023 Percentage Sales by Department
One way to think about this year’s survey vintage is that Group 1 stores were the only ones truly in the food business, while Groups 2 through 5 were essentially vitamin and supplement stores. Group 1 got 45.03% of sales from perishables; refrigerated, frozen, produce, and prepared foods combined. The next-highest stores in Group 2 clocked in at 16.54% perishables—hardly enough for shoppers to consider them as their main food-shopping destination. Stores in Groups 3, 4, and 5 all got less than 10% of sales from perishables, and all got more than 60% of sales from vitamins and supplements. Even stores in Group 2 got nearly half their sales (47.59%) from vitamins and supplements. Group 1 stores were also the only ones offering a significant prepared foods department, at 11.35% of total sales. Overall, the single largest department after vitamins and supplements at 36.7%, was dry grocery, which averaged 19.67% for all stores. All other individual departments averaged less than 10% of sales, with health and beauty aids next, at 8.49%.
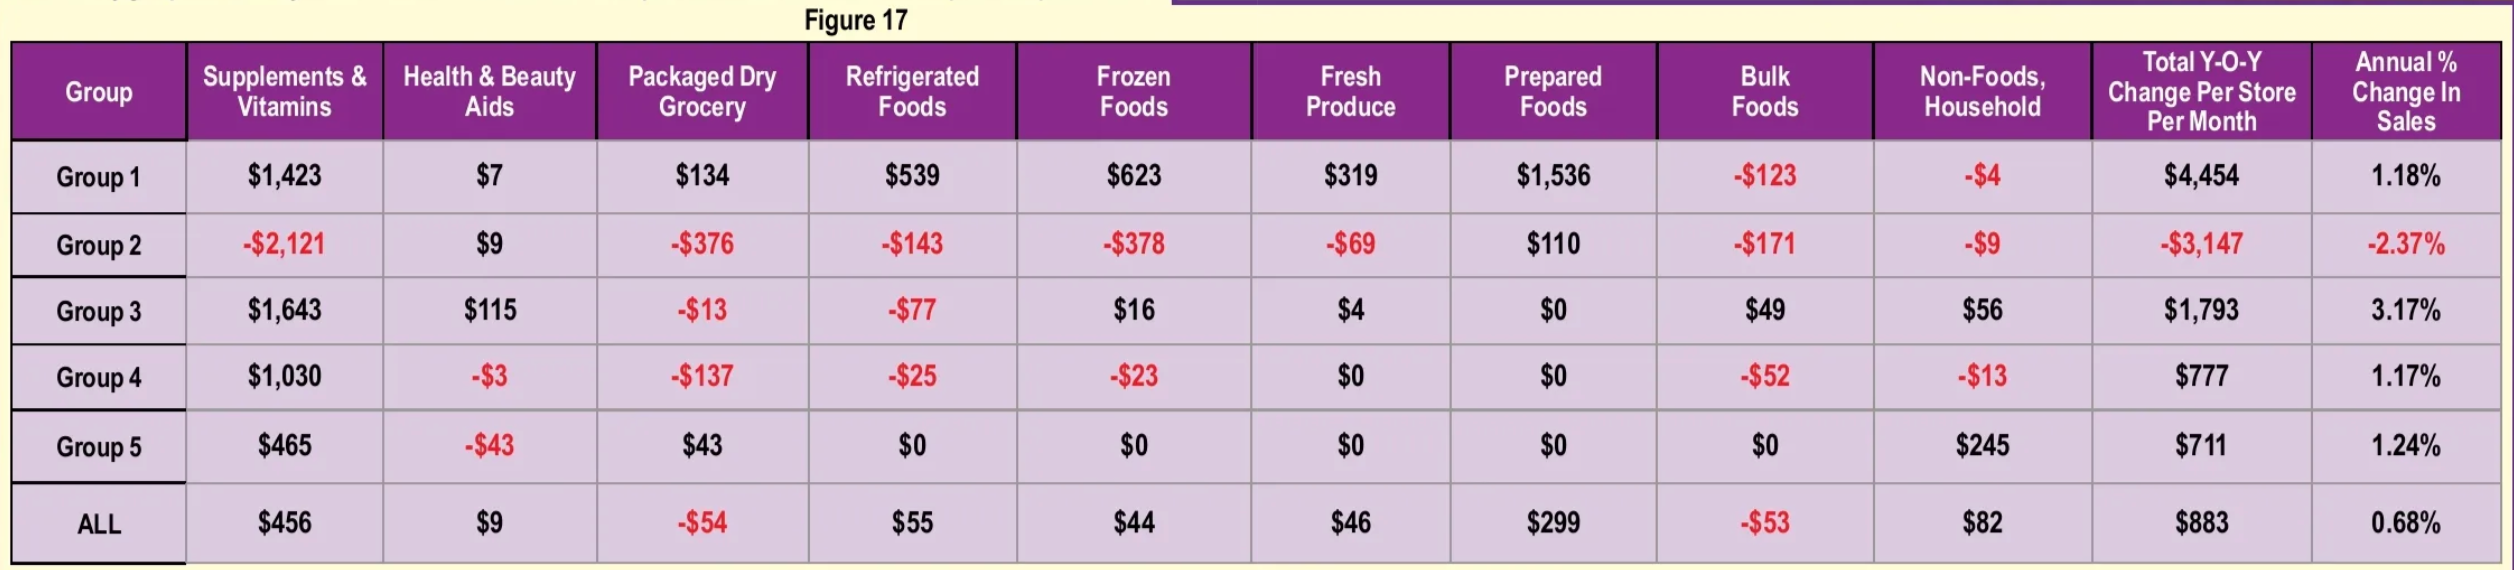
Same-Store Sales: Year-Over-Year Change per Store per Month by Department
Again, respondents tell us how their stores compared to their year-ago results. The vitamin and supplement department was the biggest year-over-year gainer in this year’s survey, adding an average $456 per store per month, with four of the five groups increasing vitamin department sales. Only Group 2 saw a decrease in vitamin and supplement sales, losing $2,121 on average per store per month. We believe the losses in Group 2—which was also the only group in the survey to see an overall annual sales decline (-2.37%)—are due to its medium size footprint of 2,879 square feet GLA. These stores offered a less-than-sufficient assortment of fresh perishables foods, which averaged just 16.54% (see figure 2) of total sales. Group 2 stores were not as efficient as smaller, vitamin-focused stores, nor well-enough stocked in perishables as larger stores in Group 1. As we’ve seen in past years, being stuck in the middle between the two business models—perishables and vitamins—is an unprofitable place to be.
Percentage of Retail Area to GLA Square Footage
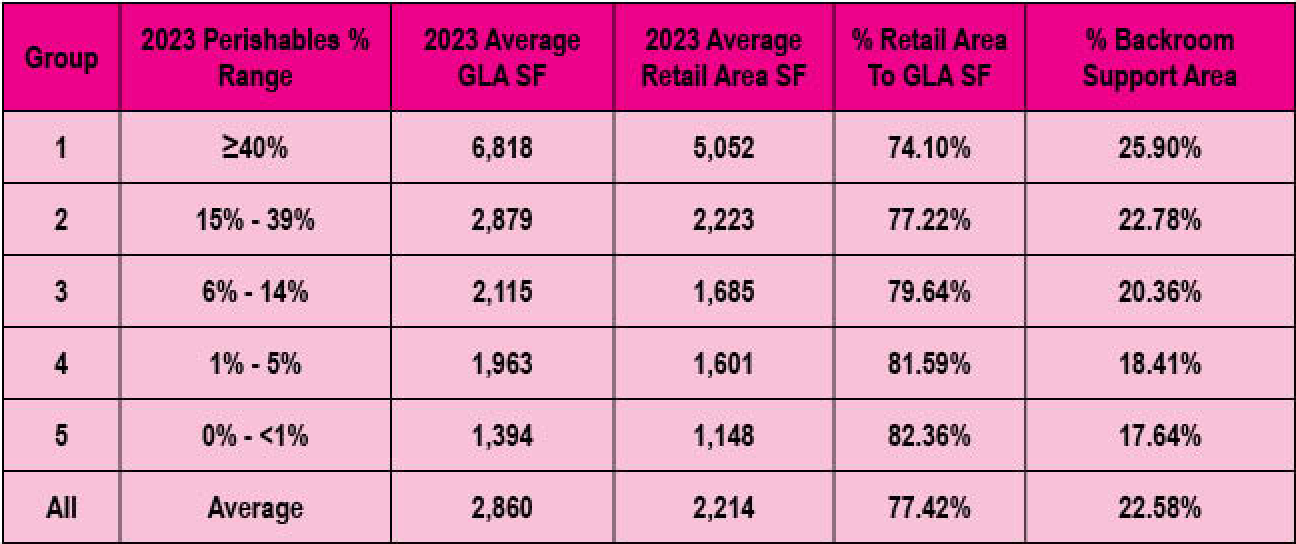
As stores carry more perishables, their back room support areas increase in size, and take up a higher percentage of GLA. Stores in Group 1 devoted a quarter of their space (25.9%) to back room support areas, likely for walk-in coolers, freezers, and produce preparation areas. Stores in Group 5, which sold less than 1% perishables, needed far less backroom support area; just over one-sixth of total GLA (17.64%).
2023 Rent Per Square Foot & Percent of Total Sales
Rent as a percentage of total sales averaged 3.46% for all stores, and ranged from 2.47% for stores in Group 1 to 5.74% for stores in Group 3. Keep in mind, with an average age of 34 years in business, stores in the survey will tend to have lower rent as a percentage of total sales than would be the case for a young store or start-up. Stores in this year’s survey paid an average $18.98 per square foot in annual rents. Stores in Group 2 appeared to pay a premium of $21.89 per square foot annually for their nearly 3,000 (2,879) average square feet. Stores in Group 1 may be enjoying an “anchor tenant” discount for their average 6,818 square feet, paying $16.43 per square foot annually. Stores in Groups 3, 4 and 5 perhaps reflect the market price for small-store square footage of about 1,400 to 2,100 square feet, averaging $17.61 per square foot annually.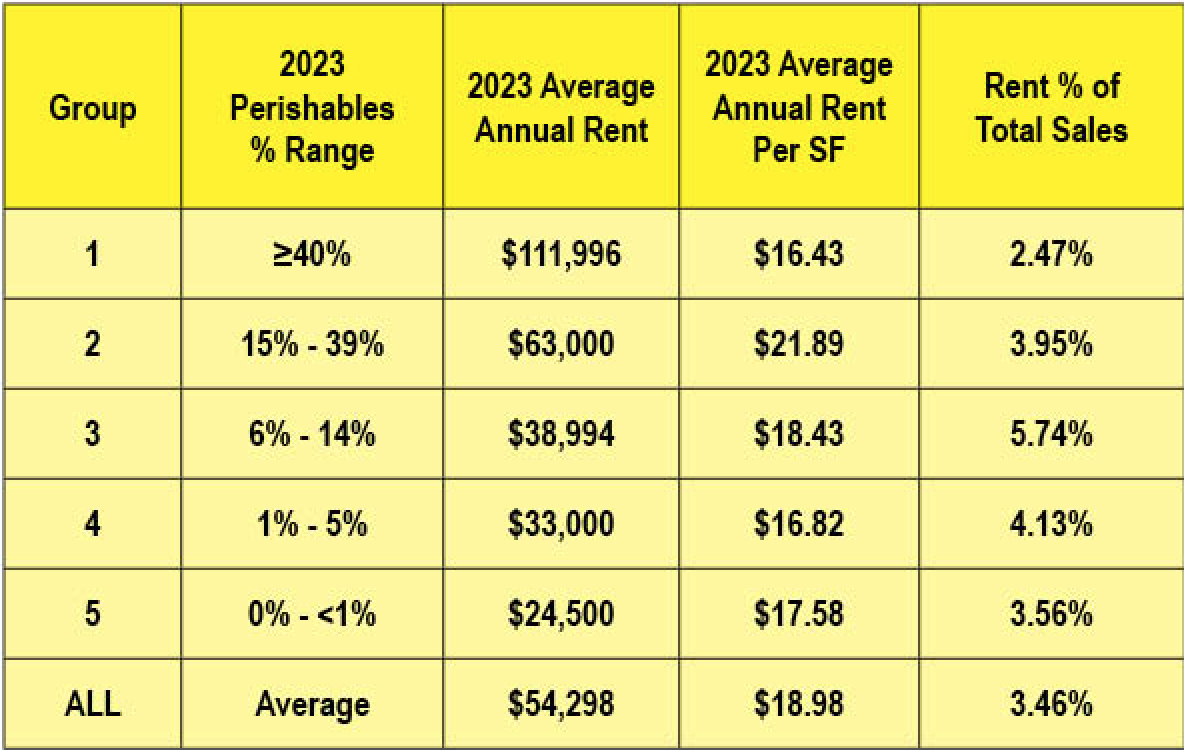
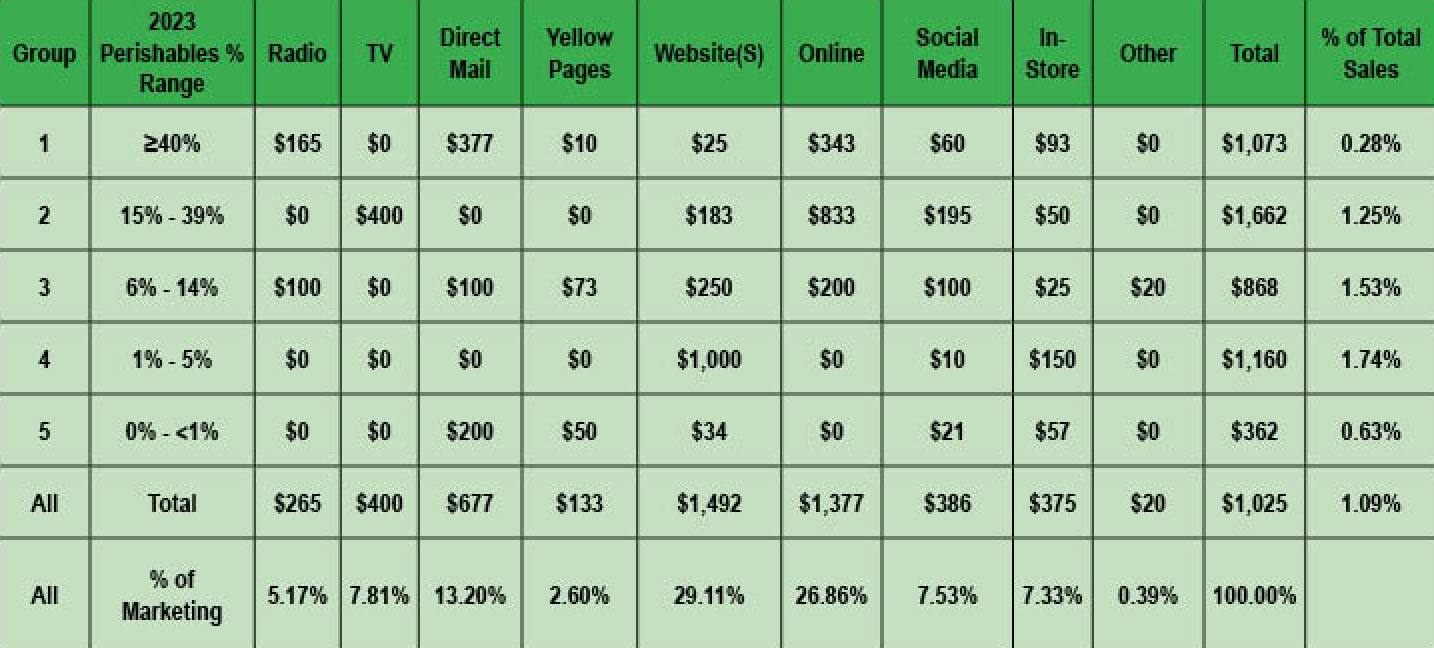
2023 Marketing Spending Monthly
Overall, respondents to this year’s survey spent just over one-percent (1.09%) of their total sales on marketing and advertising. Websites, at 29.11% of total marketing spending, took the number one slot, followed by online advertising at 26.86% of total marketing costs. Direct mail took in 13.2% of total marketing spending, with tv, social media, and in-store marketing clocking in at 7.81%, 7.53%, and 7.33%, respectively. Yellow Pages drew only 2.6% of all marketing dollars, while other marketing expenses were less than one-percent (0.39%). Websites, social media, and in-store were the only marketing categories all five Groups participated in.
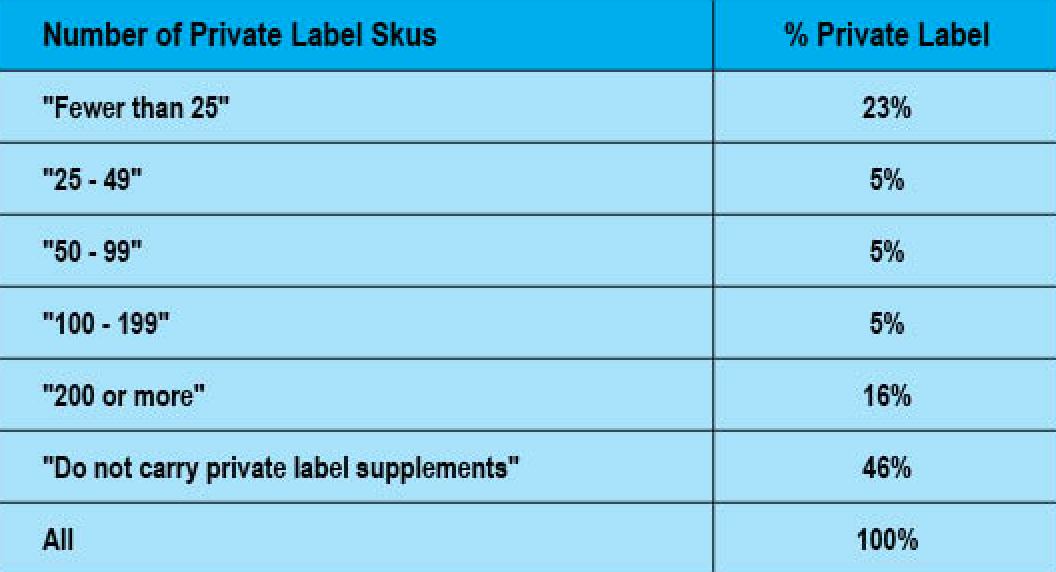
Private Label
The number of natural products retailers that carry private label nutritional supplements has been growing over the last decade, from about 25% to more than half (54%) today. About one-quarter (23%) of those that carry private label carried fewer than 25 private label SKUs. One in six (16%) of those that carried private label supplements offered 200 or more SKUs.
Forecasting the Future
The majority of the retailers who responded to this year’s survey were holding fairly steady last year, with only 2% closing a store, and 7% opening one new location. To get a sense of what the future holds, we asked respondents to share how much they expect their store sales to change in the next 12 months. Respondents this year were nearly as optimistic as pessimistic, with those predicting a sales increase expecting an average 9.38% growth. Those who expect sales to decline next year believe their sales will suffer an average decline of -11.6%.
In terms of growth, 5% of respondents plan to open one or two new stores next year, and none of the retailers in our survey said they plan on closing a store next year.
Store Expansions
Just over one in ten (11%) in this year’s survey expanded their stores between July of 2021 and June of 2022; 89% did not expand. Retailers that expanded their stores between July of 2021 and June of 2022 increased by an average of 900 square feet. Each expanded square foot cost an average $30, making total expansion cost an average of $27,000.
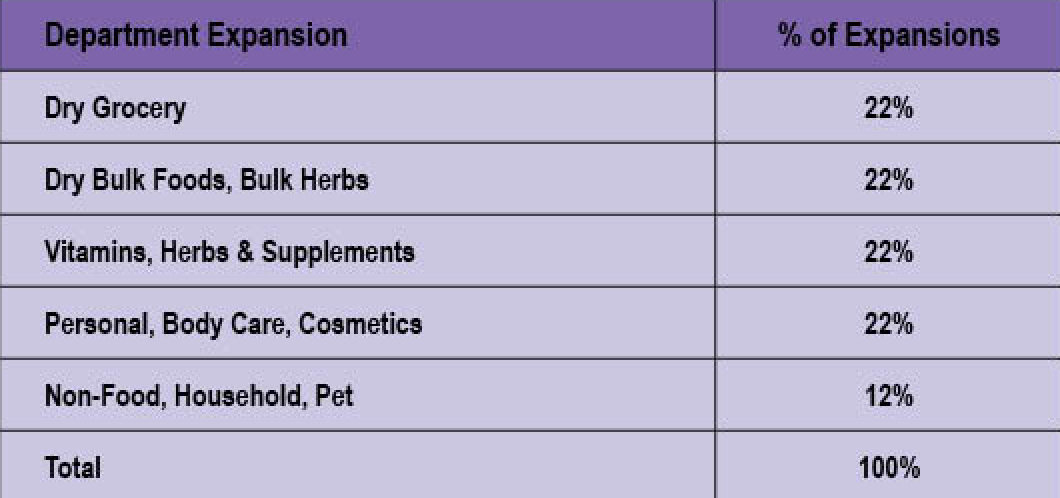
Department Expansions
Retailers steered clear of fresh perishables departments, with none opting to deal with refrigeration and freezers. Shelf-stable departments got 100% of the expansion attention this year. Dry grocery, dry bulk foods and bulk herbs; vitamins, herbs and supplements; and personal, body care and cosmetics each accounted for 22% of all expansions. Non-food, household and pet products featured in 12% of all department expansions.
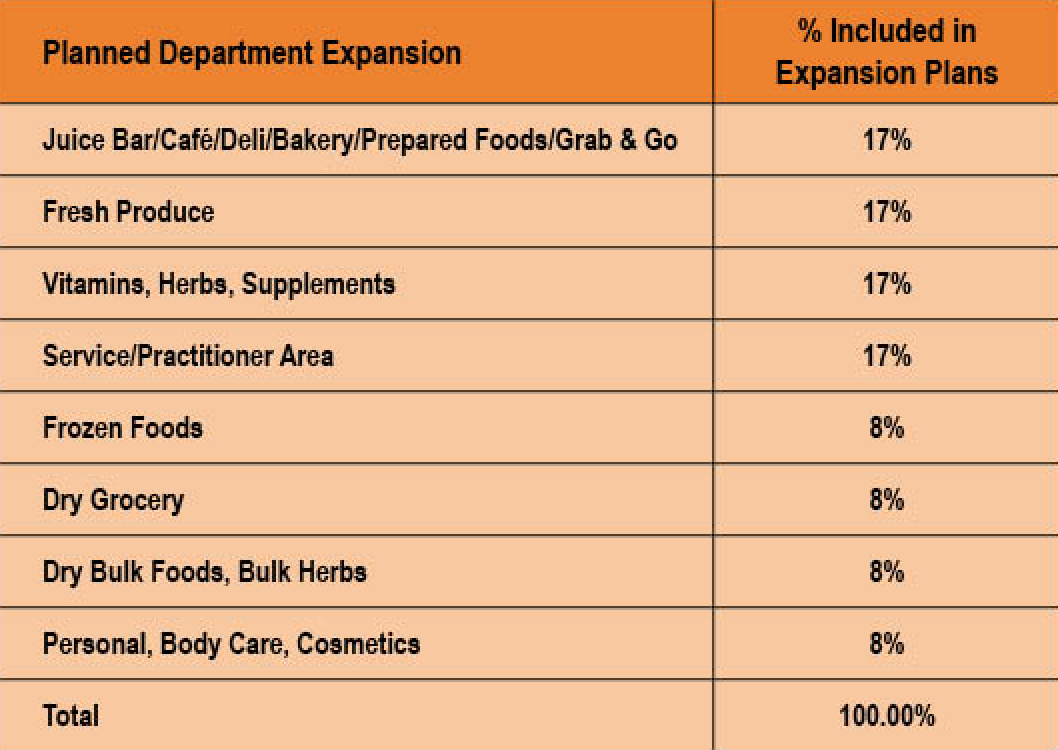
Planned Expansion
A nearly identical percentage of stores will expand next year as did last year, with 12% planning to expand and 88% standing pat. The average number of square feet retailers intend to add next year, 700, falls slightly below this year’s actual expanded 900 square feet. In what appears to be wishful thinking, respondents told us they expect to spend $9 per square foot (as opposed to $30 this year). This would bring the total expansion cost to a modest $6,300.