
Please tell us anything that is on your mind about your business… That was the first question we asked independent natural products retailers for our 2024 Annual Retailer Survey, now in its 46th year. The goal of this question: to help industry members throughout the supply chain see beyond the data, and hear directly from independents about the state of the business. As we mark the 30th anniversary of the Dietary Supplement Health and Education Act of 1994 (DSHEA), it is crucial that we recognize the needs of the brick-and-mortar stores that have long been the backbone of this industry, and that brands, ingredient suppliers, distributors and others in the natural space do what they can to support our retailers. Hear from the retailers in our Retailers Sound Off coverage.
In this survey, we will take a deep dive into the numbers. WholeFoods Magazine partnered with Readex Research to survey independent natural retailers, gathering results for the 12 months ending in June 2023. (Because we are publishing the survey in 2024, we refer to all results as 2024; the actual survey measurement period runs from July 1, 2022 through June 30, 2023).
To the retailers who participated in this survey, thank you for supporting this educational effort. This survey is used by natural products retailers to measure and improve business, and by natural products industry members throughout the supply chain to better understand and support their retail partners. Your input helps us deliver what we believe is the most accurate and complete picture of independent natural products retailing in the U.S. today.
As you read this survey, keep this important background information in mind: This survey is like sampling a glass of vintage wine. Each year, we taste from a different vineyard—the different group of respondents that participates in the survey each year. We also ask each year's group of respondents to tell us about their own prior year's results—like sampling two vintages from the same vineyard. This yields our same-store results.
What is the bottom line for independent retailers?
Did they fare better, or worse, during the 12-month survey period? You’ll find that answer within.
We also take a wider view of our industry. In 2023, sales from all U.S. independent natural retailers hit $11.9 billion, and total natural organic sales through all eight retail and food-store channels (including supernaturals such as Amazon Whole Foods Market and Sprouts Farmers Market; conventional supermarkets; mass merchandisers; pharmacies; and vitamin chain stores) was $103.6 billion in 2023 (see below). For a complete update of the U.S. natural organic retail market, read the Retail Insights® 2024 Retail Universe for U.S. Premium Natural, Organic Food, Supplement & Personal Care Sales.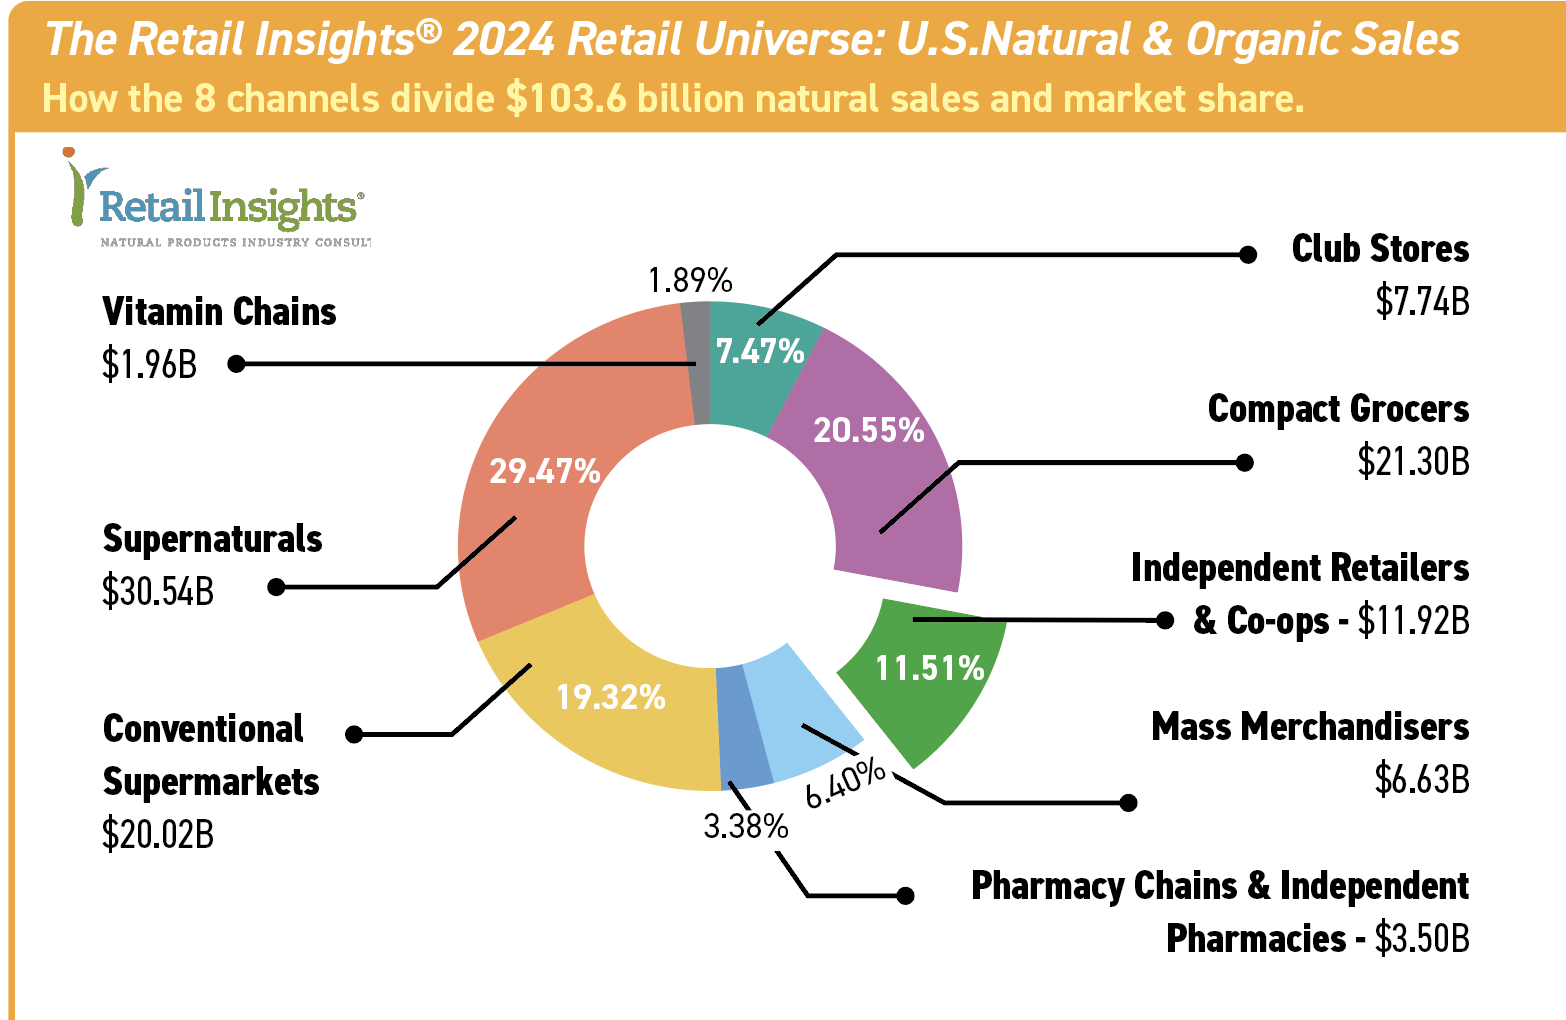
Now, let’s explore the findings that can provide you with insights that can help you strengthen your business.
Part 1: Who responded to the 2024 Retailer Survey?
Survey respondents are owners/ CEOs/presidents (62%), general or store managers (20%) and other team members including store department managers and buyers and administrative department managers (18%). On average, the stores have operated under current ownership for 26 years, and under all owners for 32 years. We are seeing more older stores changing hands—several stores that are 20+ years old turned over to new owners in the last two to three years. We also have longevity: The oldest responding store is 81; the youngest has been in business for 1.5 years.
Respondent fast facts:
12% of respondents are natural practitioners/doctors carrying natural products inventory for sale.
7% of respondents are drug stores/natural pharmacies.
7% are natural restaurants, bakeries, pet stores, and other specialty retailers.
7% are conventional supermarkets carrying a significant assortment of natural organic products.
4% are herb retailers.
76% operate 1 store; 16% operate 2-6 stores; 8% operate 7+ stores.
55% rent; 45% own the real estate
51% are open six days per week, 38% operate seven days, and 11% are open five days, including practitioners and wellness centers offering products.
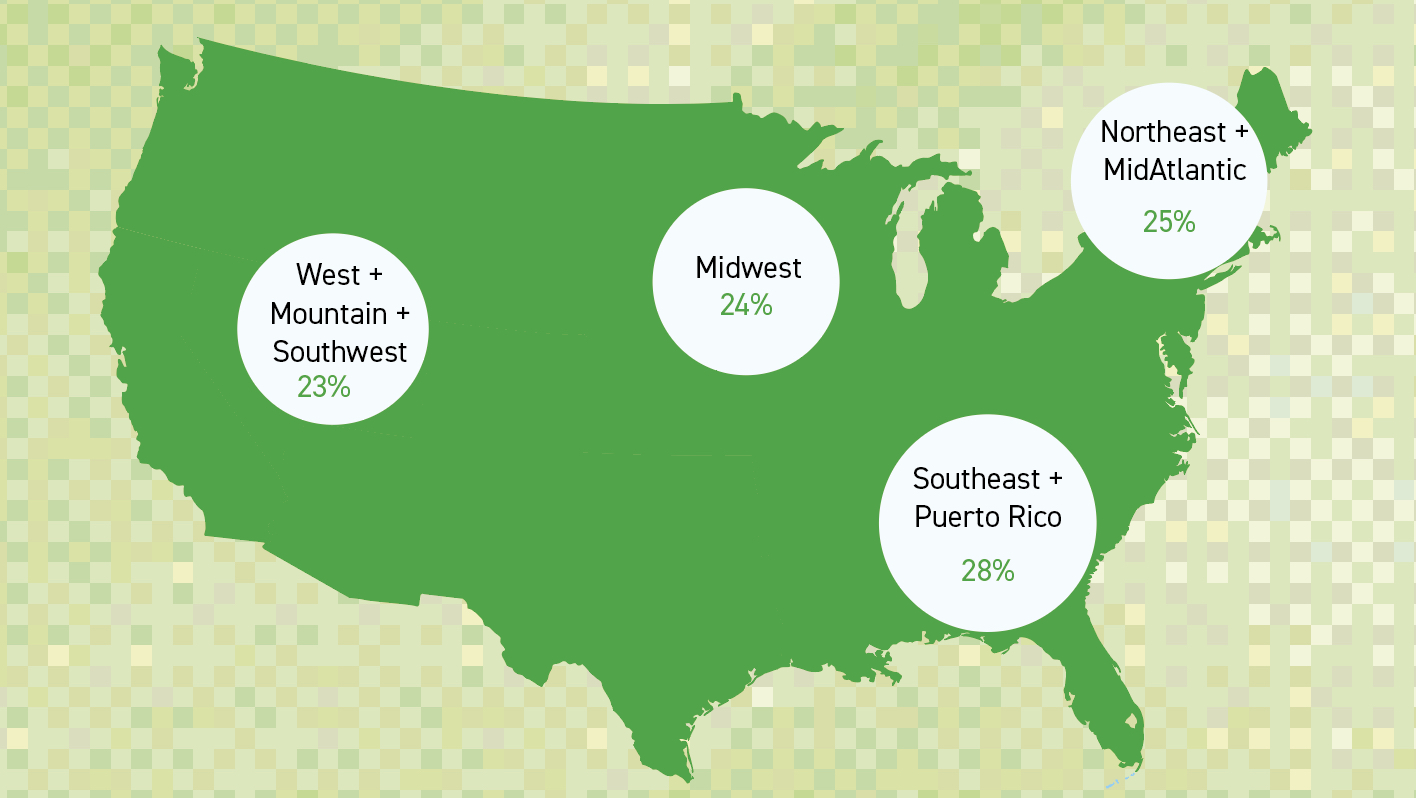 Figure 1
Our responding retailers come from across the U.S. (see figure 1, with a more detailed breakdown below), and we had wider geographic participation this year than in any previous survey year. Respondents represent every size market, giving us an in-depth picture of the industry.
37% of respondents are located in a large town or rural area (population less than 50,000)
18% of respondents are in small cities (population 50,000 to 99,999)
18% of respondents are in a large city or suburb (population 300,000 to 999,999)
15% of survey respondents are located in a medium-sized city or suburb (population 100,000 to 299,999)
12% of survey respondents are located in a major metropolitan area (population 1,000,000 or more)
For a more detailed breakdown of regions:
| Midwest | 24% |
| Southeast | 15% |
| Northeast | 14% |
| South | 12% |
| West | 10% |
| New England | 6% |
| Northwest | 5% |
| Southwest | 5% |
| MidAtlantic | 5% |
| Mountain West | 3% |
| Puerto Rico | 1% |
Part 2: What were independent retailers’ results this year, and compared to last?
How to Use This Survey
If you are an independent natural products retailer, you can compare your results to stores in this survey that are most like yours by calculating your perishables as a percentage of total sales. That number will place you in one of the survey's five groups, ranging from no perishables in Group 5 to at least 59.7% of sales from perishables in Group 1. By comparing your results to peers with similar perishables sales, you will reveal the results most relevant to you and your store.
Which group are you? Find out in 3 steps:
- Tally up your sales from the four main perishable fresh-foods departments: refrigerated, frozen, produce, and prepared foods.
- Calculate what percentage of your total sales these four categories represent.
- See figure 2 for the perishable foods percent range for each group. Compare your results to stores in your corresponding Group: 1, 2, 3, 4, or 5.
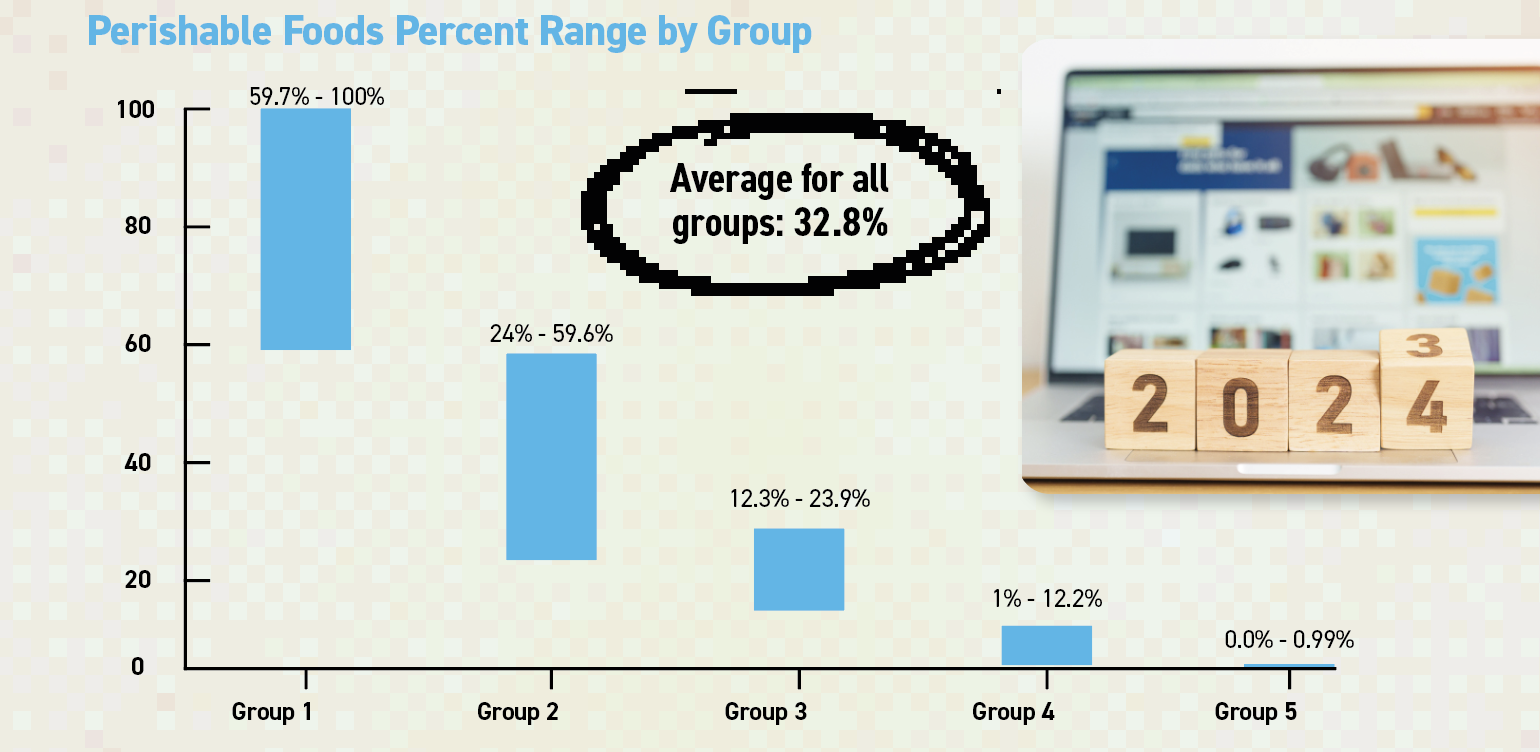
As we have observed in prior years' surveys, perishables foods are the main determinant of store size and sales. Overall for the five groups combined, stores in this year's survey averaged 32.8% of sales from perishables. Stores in Group 1 are the true full-service "grocery" markets, with over half (59.7%) of sales from perishables. Prepared foods play a large role in Group 1 stores, at 17.8% of sales (see figure 7); nearly one in every five dollars goes to the kitchen. For stores in Group 2, the percentage of fresh perishables sales drops by more than half, to just 24%, and to 6.7% for prepared foods, and 3.3% for fresh produce (see figure 7). We believe shoppers perceive the perishables selection in Group 2 stores as a convenience: not enough to attract daily food shopping. Stores in Group 3 reduce perishables sales even further, to 12.3%, with small amounts of refrigerated and frozen foods, and just 2.9% from prepared foods (see figure 7). Stores in Group 4, with just 3% of sales from perishables, offer the bare minimum of refrigerated and frozen items, and perhaps coffee, tea, and soup as prepared offerings. Stores in Group 5 are our true vitamin and supplement stores, with less than 1% perishables, and nearly eight of every 10 dollars going to nutritional supplements. (See figure 7 for a detailed look at the percentage of sales by department, and figure 7A for a look at dollar sales by department.)
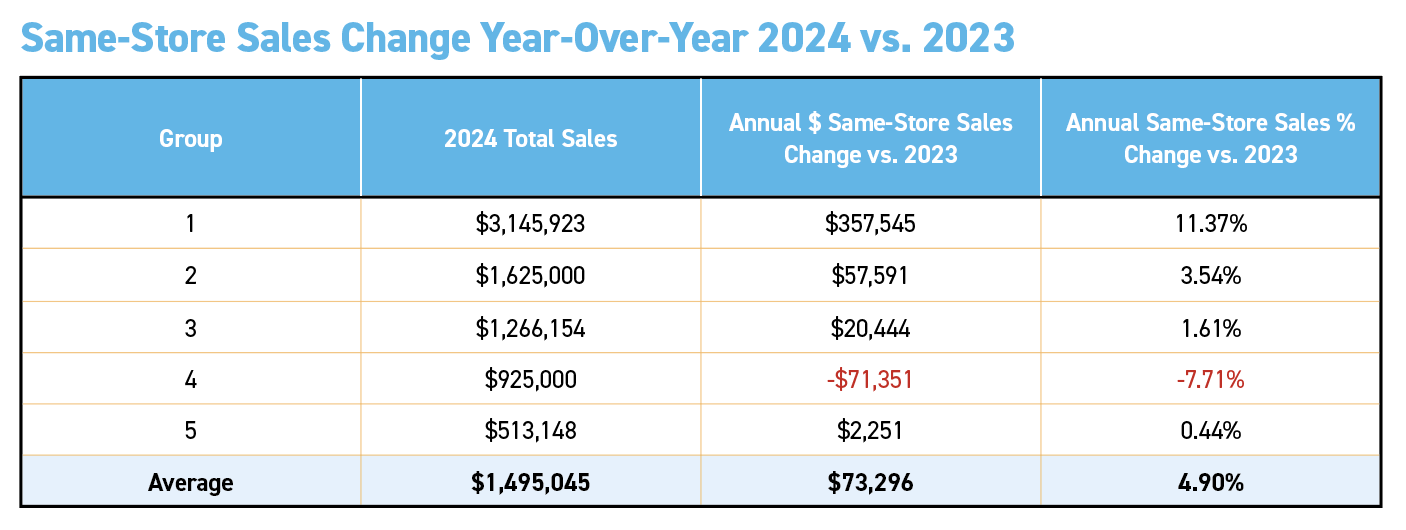
While it is interesting to compare results in each year's survey to the prior year (which is made up of a different group of responding stores) the more relevant comparison is to ask the current year's respondents how their own stores did the year before, measuring "same-store" sales change, year-over-year. Overall, same-store sales in this year's survey grew a robust 4.9%, largely driven by perishables, particularly the prepared foods departments in Groups 1 and 2. Our high-perishables stores in Group 1, with 17.8% of sales from prepared foods, had a stellar year, with $3,145,923 in total sales, up 11.37% from the year before. Stores in Group 2, with 6.7% of sales from prepared foods, saw the second highest annual growth: $1,625,000 total sales, up 3.54%. Stores in Group 3 grew 1.61% year-over-year, to $1,266,154. Stores in Group 5 stayed just above breakeven, at +0.44% with sales of $513,148.
The exception: Group 4. Sales fell a steep 7.71%. At 2,240 SF gross lease area (GLA), and just 15.9% of sales from all foods, Group 4 stores were apparently too small, with too limited an assortment of fresh foods and dry groceries, to be a regular stop for shoppers.
Strong sales for stores with good prepared foods departments, most located in the suburbs, may be due in part to the increase in remote suburban workers who leave home at lunchtime for a fresh meal. In the U.S., annual visits to suburban strip malls rose 18% last year compared with pre-pandemic, according to data-analytics firm RetailStat.
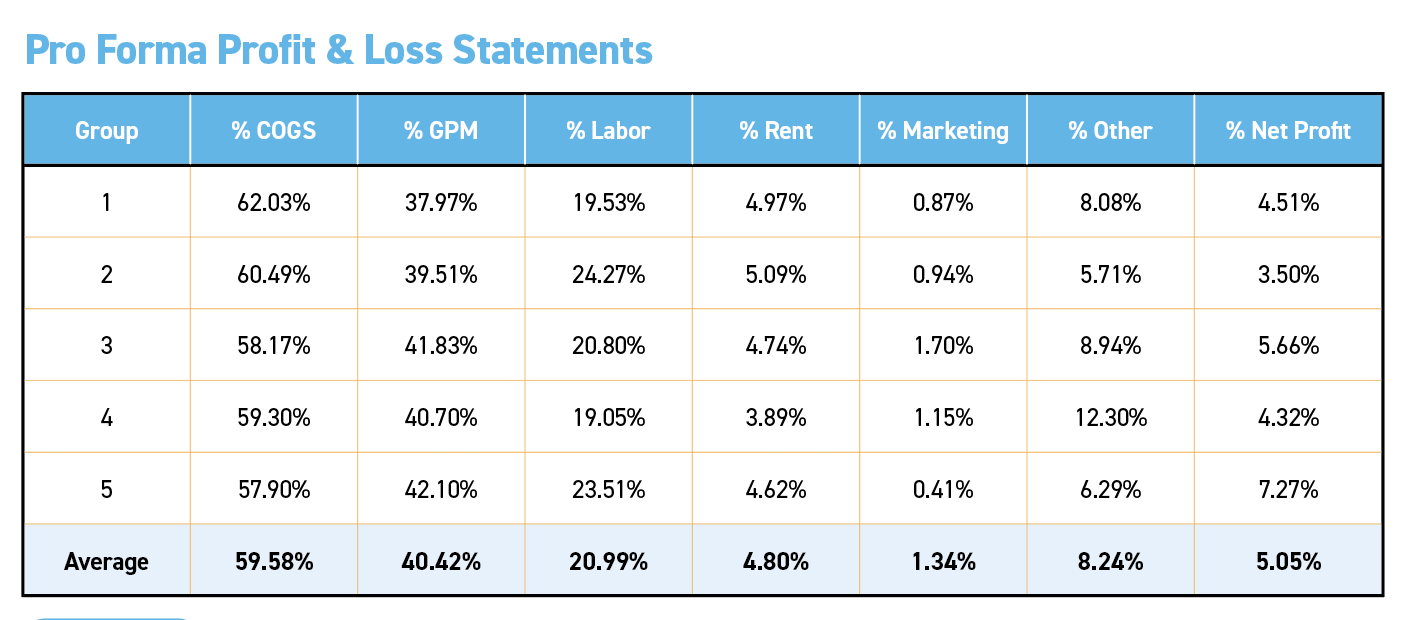 Figure 4
We assembled pro forma Profit & Loss (P&L) statements for each of the groups. This year’s respondents averaged net profits of 5.05% after all expenses including labor, rent, and marketing, a historically strong number, with no group below 3.5% net profit. Overall, gross profit margins (GPM) averaged 40.42%. (See figure 4).
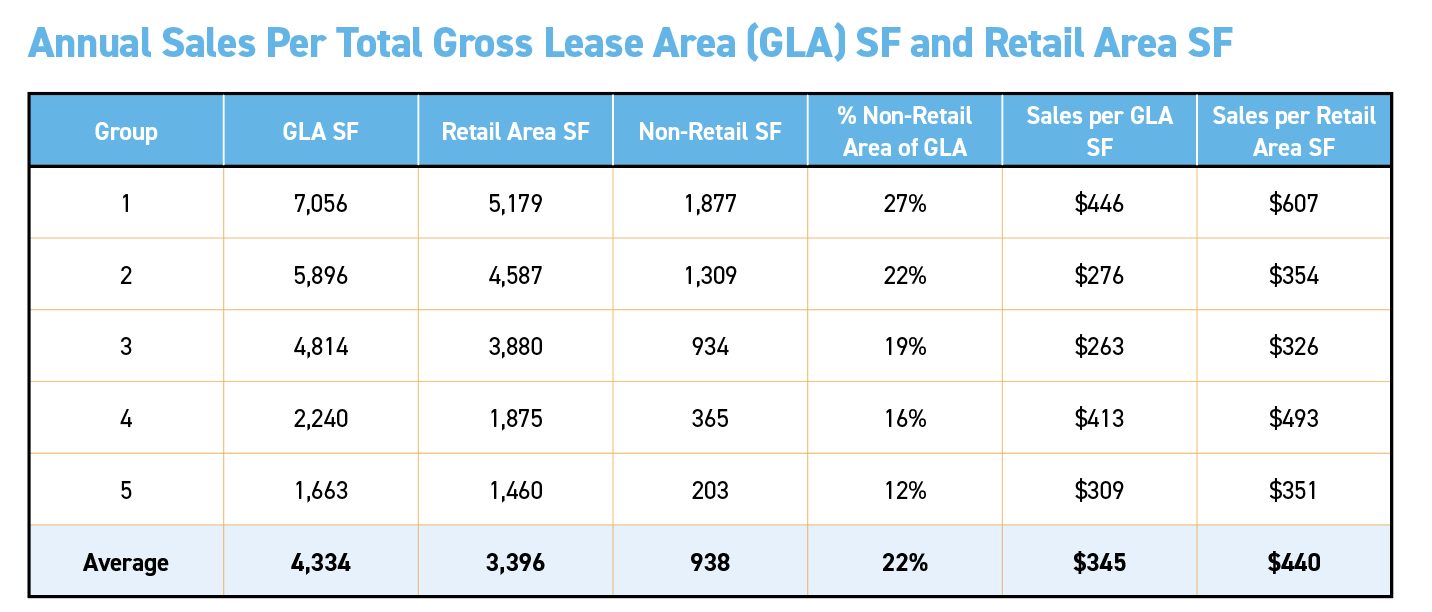 Figure 5
Total gross lease area (GLA) for stores in this year's survey ranged from 1,663 square feet for the smallest, vitamin and supplement stores, to 7,056 square feet for the largest fresh perishables markets. Annual dollars per GLA square foot ranged from $263 in Group 3 to $446 in Group 1; and dollars per retail square foot, from $326 to $607. Stores in Groups 2 and 3 this year were larger than typical for stores doing less than $2 million per year. Group 2, at $1.62 million, and Group 3 at $1.26 million, arguably have too much lease area to justify their relatively low sales, with annual sales per square foot falling below $400 in both GLA and retail areas.
As stores get larger, and carry more fresh foods, backroom support areas grow as a percentage of GLA. Non-retail support areas ranged from 203 square feet in our smallest vitamin stores to 1,877 square feet in our largest fresh foods markets. Back rooms took up more than a quarter of total GLA (27%) in the large grocers in Group 1, and got smaller with each group, down to just 12% in our smallest supplement stores.
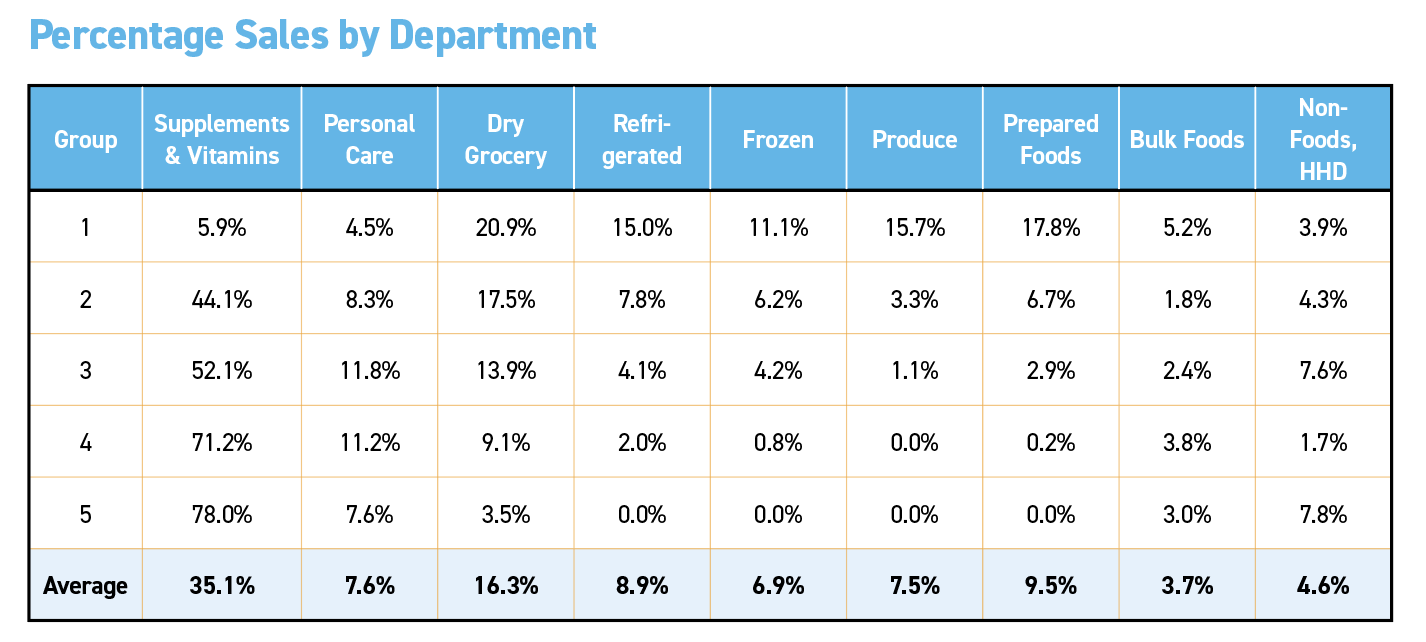 Figure 6
The single largest department in this year's survey, as in all prior surveys, is supplements and vitamins, averaging 35.1% of total sales overall. Dry grocery, at 16.3%, was the second largest single department overall, followed by prepared foods at 9.5%, refrigerated foods at 8.9%, personal care at 7.6%, fresh produce at 7.5%, frozen foods at 6.9%, and non-foods and household items at 4.6%. Bulk foods, at 3.7% of sales overall, were this year's smallest department.
When we combine all perishables with the shelf-stable food departments, total foods become the largest "department," averaging 52.8% in the survey overall. Stores in Group 1 got nearly 86 cents of every dollar from sales of food (85.8%). Total food in Group 2 was nearly half that of stores in Group 1, 43.3% of sales. Stores in Group 3, at 28.6% total food sales, offer something in each food department, including 2.9% of sales from prepared foods. Stores in Group 4, at 15.9% for all foods, sell no fresh produce, and almost no prepared foods. Likely just coffee, tea, and soup. We suspect this relative lack of groceries, coupled with the small 2,240 square foot GLA, discourages shoppers from considering Group 4 stores as a viable daily shopping option, leading to this year's average 7.71% decline in total sales. Group 5 stores, at 6.5% for all foods, offer no perishables at all, and a minimal amount of dry grocery and bulk items. (See below.)| Total Food Sales: Perishables Plus Dry Grocery and Bulk Foods | % Total Food Sales |
| Group 1 | 85.8% |
| Group 2 | 43.3% |
| Group 3 | 28.6% |
| Group 4 | 15.9% |
| Group 5 | 6.5% |
| Average | 52.8% |
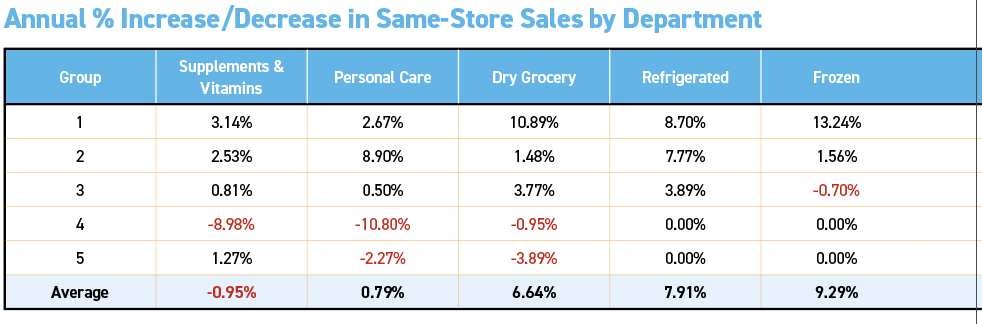
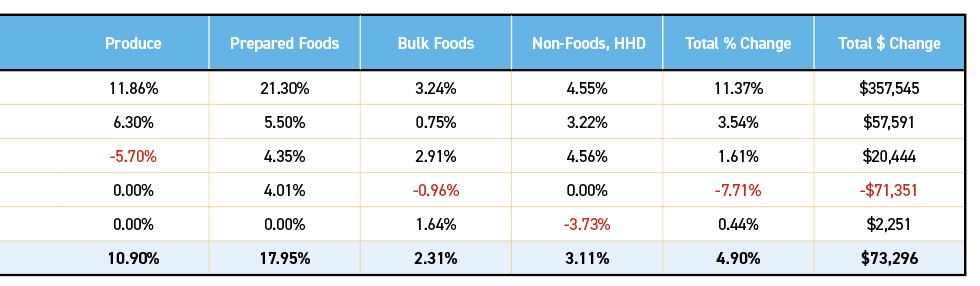 Figure 7
The department with the strongest growth in the survey overall was prepared foods, up 17.95%.This gain was driven almost entirely by the high-perishables stores in Group 1, whose prepared foods departments grew 21.3% on average. Prepared foods also grew in Groups 2, 3, and 4; up between 4% and 5.5%.
Fresh produce followed in second place, with 10.9% growth overall, again driven entirely by departments in Groups 1 and 2. Frozen iced the third spot, with sales up 9.29%, exclusively from departments in Groups 1 and 2. Refrigerated foods came in fourth, with sales up 7.91%, and contributions from Groups 1, 2 and 3.In fifth place was dry grocery, up 6.64% in the survey overall, again driven by departments in Groups 1, 2 and 3. Dry grocery sales declined in Groups 4 and 5, our smaller, low-perishables stores. In sixth and seventh place, non-foods and bulk foods departments grew 3.11% and 2.31%, respectively. Personal care departments were nearly flat, at an 0.79% gain overall.
Vitamin and supplements were the only department in the survey overall that saw a net decline, of -0.95%, dragged down by the 8.98% decline for stores in Group 4. All other groups managed growth from 0.81% in Group 3 to 3.14% in Group 1. (See figure 7, and see figure 7A for annual sales by department.)
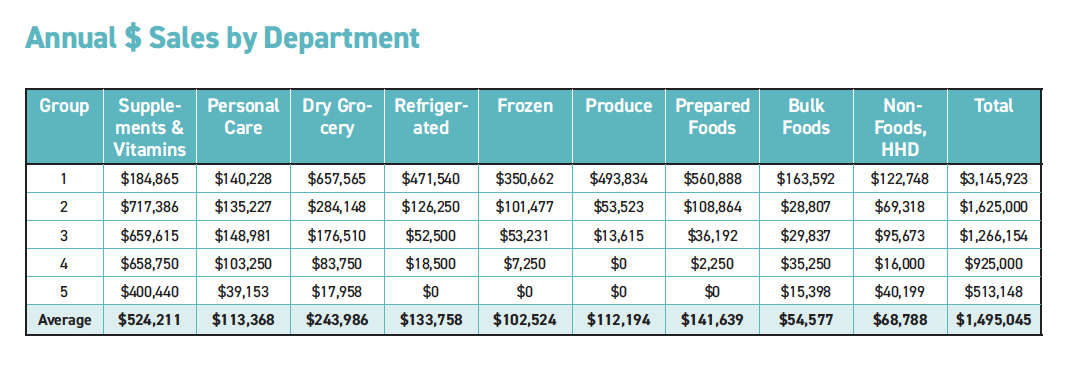 Figure 7A
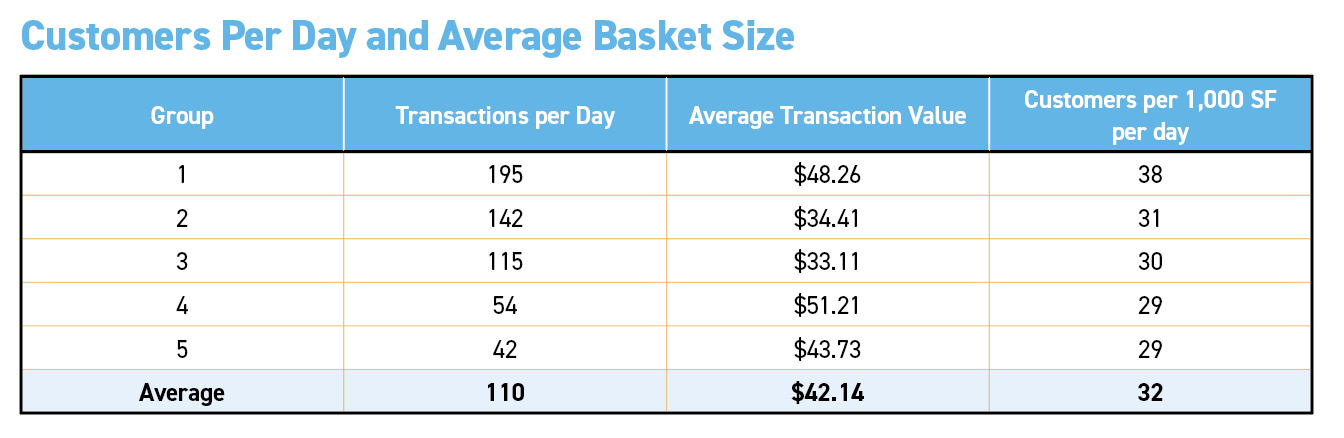 Figure 8
As stores increase in size, so does the number of daily transactions. Large fresh-perishables stores in Group 1 saw the highest daily customer counts at 195. Customers per day trend down with each group, to 42 customers per day in Group 5’s supplement-focused stores.
Stores in Groups 2 through 5 saw about 30 customers per 1,000 square feet per day, while high-perishables stores served nearly 38 customers per 1,000 square feet per day, or 28% more compared to lower-perishables stores on average.
The overall average transaction of $42.14 is down from $47.88 in last year's survey. This decrease is consistent with what conventional grocers reported in 2023 as customers cut back purchases in response to food inflation.
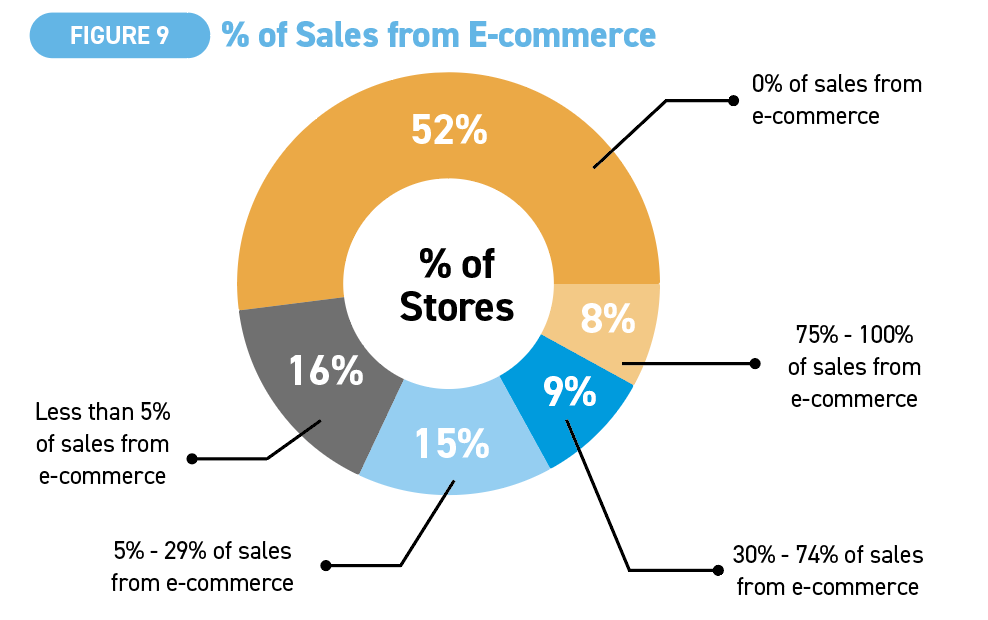 Figure 9
Just over half of all respondents, 52%, did not sell through e-commerce, while 16%, got less than 5% of sales from e-commerce. Another 15% got between 5% and 29% of sales from e-commerce and 9% got between 30% and 74% of sales from e-commerce. A final 8% got at least 75% of sales from e-commerce.
Online competition is a major concern. One retailer told us: “We are blessed that local customers go out of their way to shop locally, but with inflation and price increases, it's obvious that many consumers are shopping online more than in stores. I don't think that people are aware of Amazon's deceptive third party sellers and bad products sold online.”
Another independent shared: “After 30 years in business, I have seen our industry dramatically change. The internet/Amazon has interjected itself as the price determiner. MAP [minimum advertised price] policies are not well policed by many of the larger companies who can afford to do so. Supply seems to have demoted the Independent Retailer to supply the mass marketers. Therefore, the source of reliable information on products, from the Independent Retailers, is still being obtained using our staff and training to educate the internet buyer. There are still companies TRUE to the industry who are Independents themselves and we need to start supporting them with our dollars.”
Echoing that sentiment: “Competing with Mass/Online has continued to be a challenge. Now, more than ever, we are extremely selective in who we choose to partner with.”
Part 3: How did retailers market and manage their business?
Getting to know the independent retailer a bit more, we asked respondents a series of questions about operations. What we learned: All stores in the survey permit in-person, in-store shopping. Most stores (59% of respondents) allow customers to call, email, or text orders in; 39% ship orders via UPS, FedEx, USPS, or other common carriers. More than one-third of respondents (37%) allow customers to pre-order and pick up in-store, and 33% permit pre-orders with curbside pick up. A minority of stores, 16%, allow customers to order through the "Contact Us" area of their website. Just 8% of stores have an online product catalog with e-commerce payment available.
Regarding delivery, 11% of stores allow employees or independent contractors to deliver orders to customer homes, while only 8% of stores ship orders via third-party online order/delivery, or through an online application. Just 4% of stores use a third-party warehouse-fulfillment service with separate inventory to ship orders to customers.
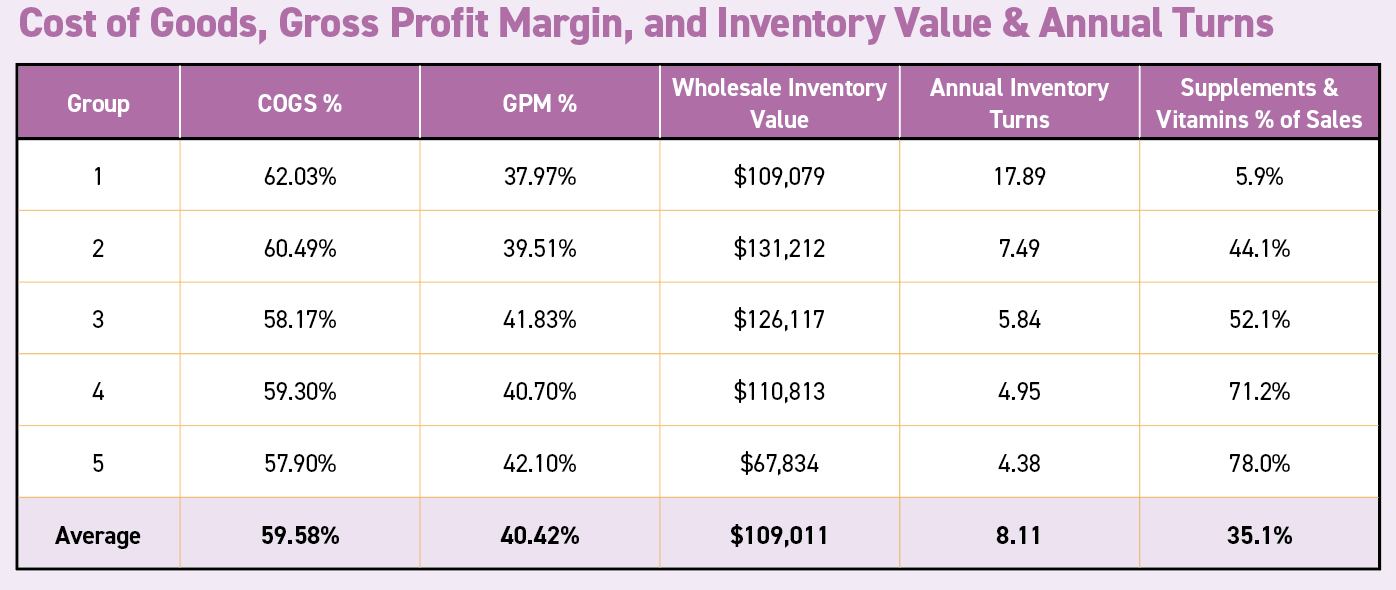 Figure 10
The dramatic increase in food inflation over the last year did not appear to crimp profits. Independents in this year's survey saw cost of goods (COGS) lower by 1.83 percentage points, to 59.58% of sales, compared to the 61.41% reported by the separate "vintage" of stores in last year's survey. Gross profit margins (GPM) rose to 40.42% from the 38.59% reported by the different group of stores in 2023's survey. The strong GPMs reflect the ability of independents to maintain or increase retail prices to keep ahead of inflation. As in prior years, supplement-focused stores in Group 5 enjoyed the highest gross margins, at 42.1%. In general, as the percentage of food sales increased, GPMs shrank (to 37.97% for Group 1).
As in past years, annual inventory turns rose as the amount of food, (especially perishables) rose. Stores in Group 2 this year had a higher percentage of vitamins and supplements than typical (44.1% in Group 2 vs. 5.9% in Group 1), which cut inventory turns compared to the high-perishables group (7.49 in Group 2 vs. Group 1's 17.89 turns). Notice that Group 2’s inventory value is higher than Group 1: $131,212 vs. $109,079. Vitamins as a percentage of sales were also higher than typical in Group 3, making Groups 2 through 5 perform more like vitamin stores than food stores.
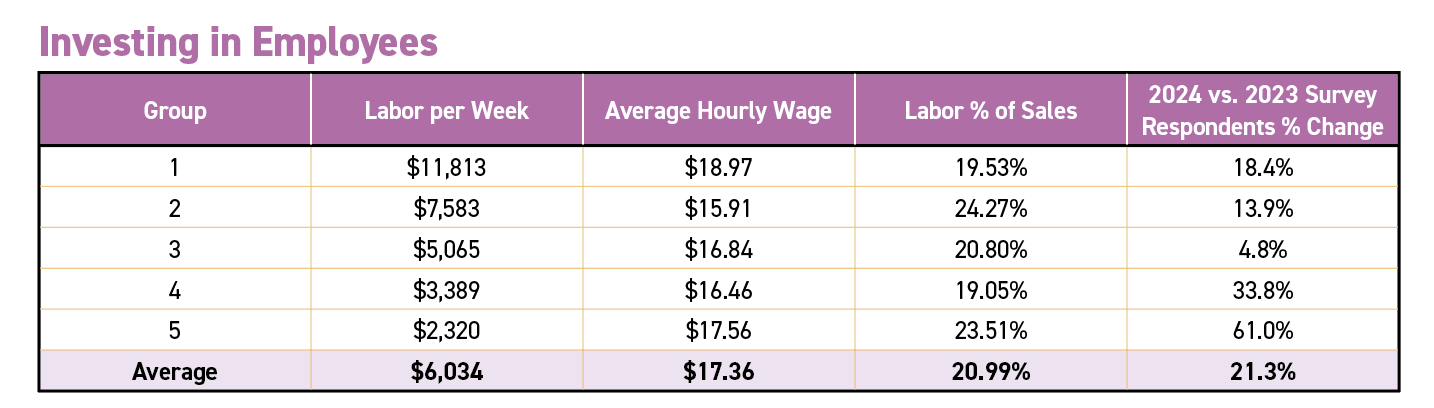 Figure 11
Inflation hit labor costs this year, rising to an average 20.99% of total sales compared to 17.3% in last year's survey of different stores; a gut wrenching 21.3% increase. All Groups reported higher labor costs compared to last year's survey cohort, ranging from a 4.8% increase in Group 3 to a 61% increase in Group 5. Stores in Group 2 paid the highest percentage of sales in wages, at 24.27%. Stores in Group 1 paid the highest average hourly wage, $18.97, likely due to needing more professional culinarians in their large prepared foods departments.
One retailer lamented: “Labor costs are soaring to keep good employees. Profit margins are too close to nonexistent. Employee insurance and benefit costs are skyrocketing.”
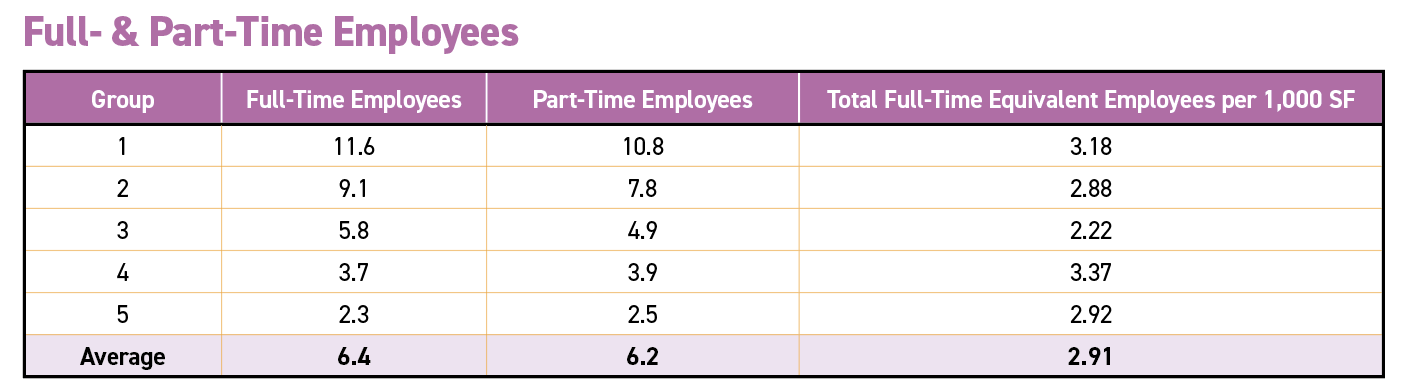 Figure 12
As stores increase in size, so do the number of full- and part-time employees. Part time workers average 20 hours per week, while full time workers average 35 hours per week. It took an average of 2.91 full-time-equivalent (FTE) 35-hours-per-week employees per 1,000 square feet to operate the typical store (see figure 12).
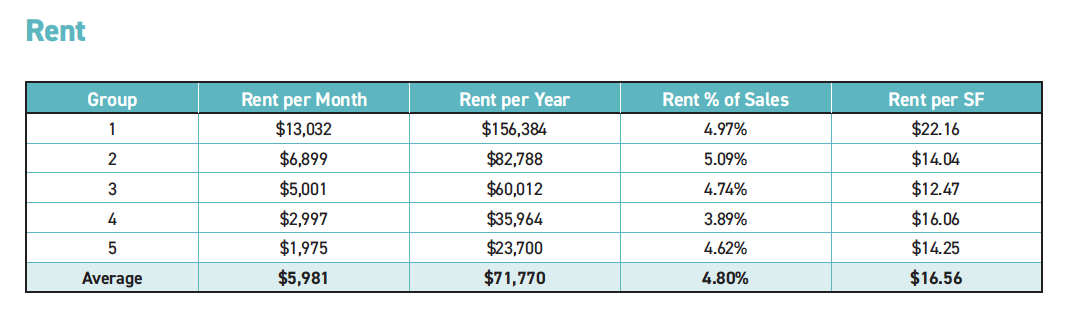 Figure 13Overall rent averaged 4.8% of sales in this year's survey. Keep in mind, the average age of all stores in the survey is 26 years, with many likely enjoying lower-cost, long-term leases, and ample time to grow high top-line sales. Younger stores typically spend more on rent as a percentage of sales compared to our survey group. Rent per square foot ranged from $12.47 in Group 3 to $22.16 in Group 1, and averaged $16.56 overall (see figure 13).
| 1 | 0.02% | 0.01% | 0.00% | 0.00% | 0.00% | 0.01% | 0.00% | 0.02% | 0.00% | 0.07% | 0.87% |
| 2 | 0.03% | 0.00% | 0.00% | 0.00% | 0.01% | 0.00% | 0.00% | 0.02% | 0.01% | 0.08% | 0.94% |
| 3 | 0.01% | 0.00% | 0.06% | 0.00% | 0.05% | 0.00% | 0.00% | 0.01% | 0.01% | 0.14% | 1.70% |
| 4 | 0.03% | 0.00% | 0.00% | 0.00% | 0.01% | 0.01% | 0.00% | 0.02% | 0.02% | 0.10% | 1.15% |
| 5 | 0.06% | 0.03% | 0.00% | 0.06% | 0.14% | 0.00% | 0.06% | 0.06% | 0.00% | 0.03% | 0.41% |
| Avg | 0.03% | 0.01% | 0.01% | 0.01% | 0.02% | 0.00% | 0.01% | 0.02% | 0.01% | 0.11% | 1.34% |
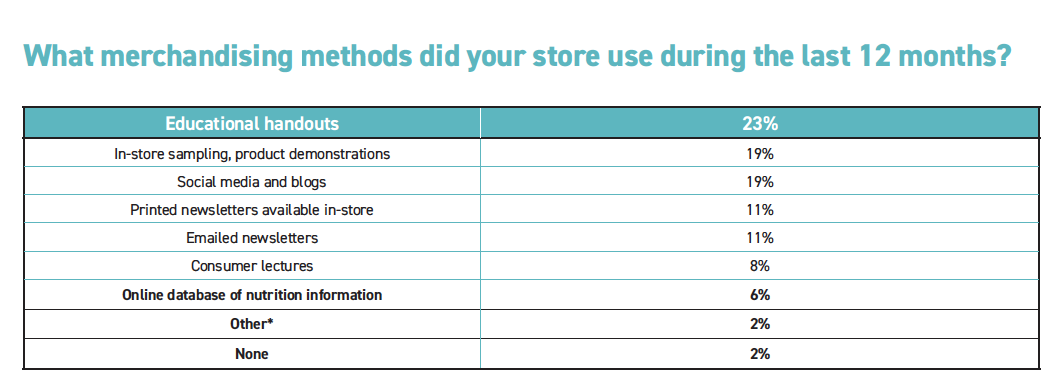 Figure 15 *Other merchandising methods included relaying client-specific health information from internet conferencesThe most popular merchandising method for stores in the survey was educational handouts (23%), followed by in-store sampling and product demonstrations (19%). Social media and blogs rank high on storekeepers' lists, with 19% using these methods. Printed newsletters available in-store and emailed newsletters each were employed by 11% of survey respondents. A small minority of stores, 8%, invested in consumer lectures. Another 6% of respondents relied on online nutritional databases, and a final 2% used some other merchandising method.
Private Label
Part 4: Past & Future. Openings, Closings, Expansions, and Forecasts
Most retailers in the survey, 47%, told us sales were about flat through the 12 months ended June 30, 2023. More than a third (36%) saw sales decline, while 17% enjoyed a sales increase. The average increase was 9.7% while the average decrease was 13.8%.
About one-in-10 (9%) of stores expanded or remodeled a small amount of space last year, averaging 400 square feet. The average remodeling cost per square foot was $30. We believe the tepid increases in square footage reflect the continuing recovery from the pandemic shock, with retailers planning larger products next year (see below).
We asked what departments/categories retailers added, expanded, or remodeled during the survey period. The department most often expanded or remodeled was vitamins, herbs and supplements, included in 28% of all plans. Juice bar, café, deli, bakery, prepared foods and grab & go figured in 14% of all plans. Frozen foods; personal, body care, cosmetics; service and practitioner areas made up the remainder of departments scheduled for changes.
Six percent of survey respondents closed one store last year, and 2% closed two stores.
Four percent of respondents opened a single new store this past year; 2% opened two stores, and 2% opened three stores.
Optimism abounds for the coming year.
Fully 38% of respondents expect sales to increase by an average 11%. Among the small minority, 6% of respondents who expect to lose sales, the forecast decrease averages 13.25%. More than half, 56% of respondents, expect sales to remain the same.
Looking to the future, more respondents than last year (13%) intend to expand or remodel, with much bigger plans, averaging 1,563 square feet. The average cost is expected to be $19,333. Once again, vitamins, herbs, and supplements will top the list of department changes, in 15% of all plans. Frozen foods likewise will figure in 15% of the changes. Refrigerated foods, dry grocery, and personal, body care, and cosmetics are next, included in 12% of plans. Juice bar, café, deli, bakery, prepared foods and grab & go, fresh produce, and services and practitioner areas make up 8% of all plans. Dry bulk food, bulk herbs, non-foods, household, and pet departments are scheduled in 4% of all plans.
Four percent of survey respondents plan to add one store in the next 12 months, and another 4% of survey respondents plan to close one store in the next 12 months.
Addendum: Comparing this year's survey stores to last year's "vintage" (the 2024 vs. 2023 survey respondents)
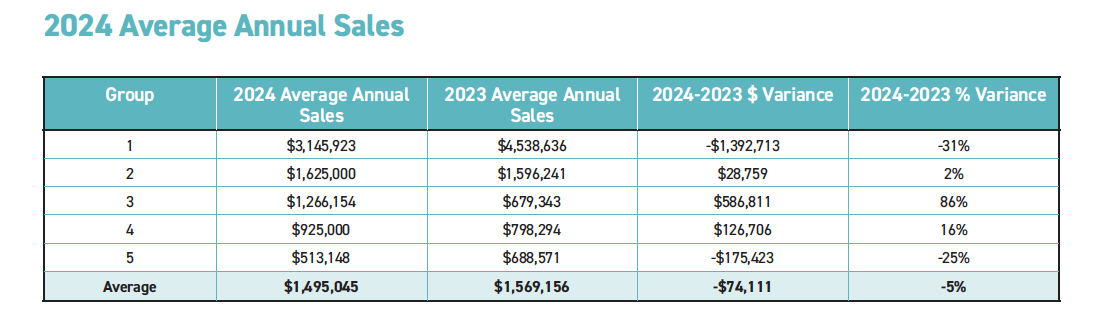 Figure 16
Figure 16Average annual sales for all stores in this year's survey were $1.495 million, 5% lower than last year's $1.569 million vintage of different stores. As in every survey year, a different group of independent natural products retailers participates, with the results as varied as wine from a different vineyard. Also this year, we had much wider participation across the country, including a large contingent from the Midwest. Sales ranged from $513,148 for our supplement-focused stores in Group 5 to $3,145,923 in our large high-perishables grocers in Group 1 (see figure 16).
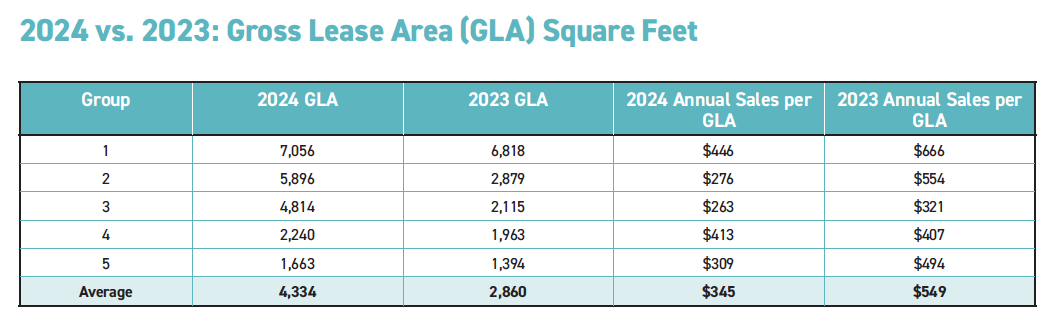 Figure 17
The larger average sizes of stores in Groups 2 and 3 in this year's survey compared to stores in the 2023 survey had the effect of reducing the per-square-foot annual sales (see figure 17).
| 2024 vs. 2023: Labor as a Percentage of Sales | ||||||
| Group | Labor per Week | Average Hourly Wage | Labor % of Sales | 2023 Labor % of Sales | 2024 vs. 2023 Change in Labor Percentage | 2024 vs. 2023 Percentage Change |
| 1 | $11,813 | $18.97 | 19.53% | 16.49% | 3.03% | 18.4% |
| 2 | $7,583 | $15.91 | 24.27% | 21.30% | 2.96% | 13.9% |
| 3 | $5,065 | $16.84 | 20.80% | 19.85% | 0.95% | 4.8% |
| 4 | $3,389 | $16.46 | 19.05% | 14.24% | 4.81% | 33.8% |
| 5 | $2,320 | $17.56 | 23.51% | 14.60% | 8.91% | 61.0% |
| Average | $6,034 | $17.36 | 20.99% | 17.30% | 3.69% | 21.3% |
Inflation hit labor costs this year, rising to an average 20.99% of total sales from 17.3% in last year's survey; a gut wrenching 21.3% increase. All Groups saw labor increase as a percentage of sales, from 0.95 percentage points, up 4.8%, in Group 3, to a whopping 8.91 percentage points, up 61%, in Group 5. Stores in Group 2 paid the highest percentage of sales in wages, at 24.27%. Stores in Group 1 paid the highest average hourly wage, $18.97, likely due to needing more professional culinary help in their large prepared foods programs. Retailers were able to offset the large increases in labor cost percentages by raising prices and gross profit margins, and increasing topline sales. WF