Our 42nd annual retailer survey yielded a large response—our largest yet. Respondents represent nearly 800 stores, including some of the largest and best independent natural organic retailers from every region of the country. Overall, stores that responded to this survey run more than one million transactions through their registers every week...is that enough to boost profits?
To get that answer and provide the most accurate reflection of the independent sector, we compared this year’s same-store sales (survey period of July 2018 to June 2019) to last year’s, and determined that growth was 0.86%. Considering the competition independents face from online retailers such as Amazon and conventional stores that are expanding their reach into natural and organic, it seems flat is the new “up.”
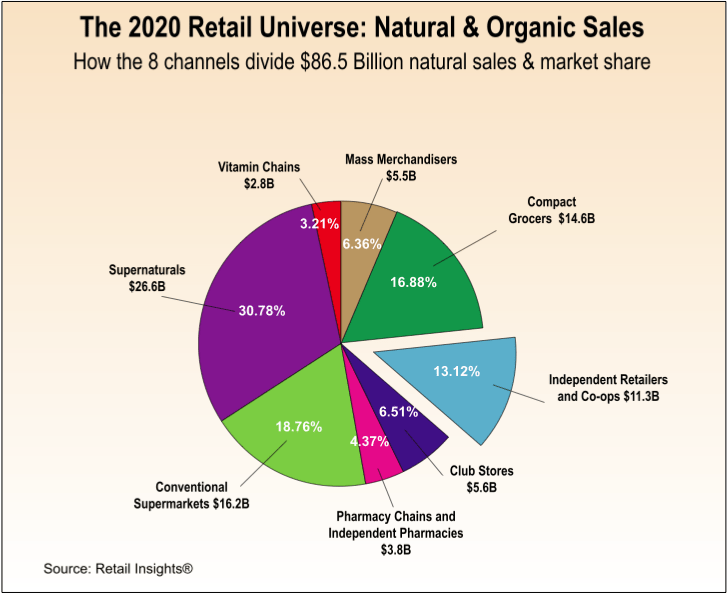
Average store sales for this year’s respondents were $3,067,015. Looking beyond that survey average, sales from all U.S. independent natural retailers in 2019 rings in at $11.3 billion. And that is a slice of the $86.5 billion in total natural organic sales through all eight retail and food-store channels (including supernaturals such as Amazon Whole Foods Market and Sprouts Farmers Market; conventional supermarkets; mass merchandisers; pharmacies; and vitamin chain stores) in 2019. For a complete update of the U.S. natural organic retail market, see the Retail Insights® 2020 Retail Universe for U.S. Premium Natural, Organic Food, Supplement & Personal Care Sales here.
 We're about to take a deeper dive into the survey findings, so you can see how your store stacks up. Mark your calendar for our webinar on Wednesday, April 29, at 2:00 p.m. EST. Jay Jacobowitz and Maggie Jaqua will discuss key findings from the survey that will help inform your business decisions and set you up for greater success in 2020 and beyond. You can also access the webinar on demand on the website in our online education center in early May.
A Look at the Respondents
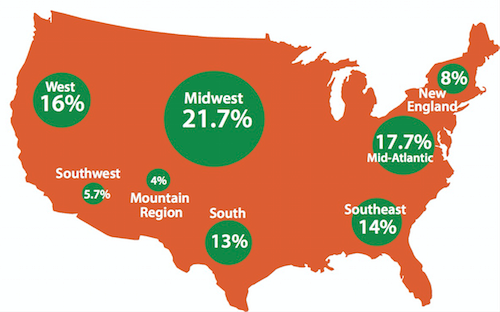
Once again this year, WholeFoods partnered with Readex Research to gather results for the 12 months ending in June 2019. Survey respondents represent nearly 800 stores, more than 600 of which were valid responses. Taking a closer look at who responded, nearly 60% of those filling out the survey were the owner/CEO, and 35% were managers. To all those who participated in this year’s survey, thank you for carefully and completely filling out the questionnaire. Your responses help us provide what we believe is the most accurate picture of independent natural products retailing in the U.S. today, with information that natural products retailers can use to measure and improve business.We heard from retailers from every area of the country (See Figure 1) and every market size: • Large towns/rural areas (population of less than 50,000): 35.9% • Small cities (population of 50,000 - 99,999): 23.6% • Medium cities or suburbs (population of 100,000 - 299,999): 16.9% • Large cities or suburbs (population of 300,000 - 999,999): 11.6% • Major metro areas (population of more than 1 million): 12%
Fast facts about our respondents: • 28% operate one store, while 72% operate two or more • 32 years is the average that respondents have been in business • 24 years is the average under current ownership • 4.4% of all stores in our survey are new owners of 1 year or less • 14% have owned the store for 5 years or fewer • 10% have been in business for 10 years or fewer • 11% of the stores are 50 years or older • Some of the oldest stores in the country responded: 5 stores are in their 90s and 3 are more than 100 years old.
How to Use This Survey
Independent natural products retailers will get the most out of this survey by first tallying up your sales from four main perishable fresh-foods departments: refrigerated, frozen, produce and prepared foods. Once you find what percentage of your total sales these four categories represent, you can compare your results to similar stores in your corresponding Group—either Group 1, 2, 3, 4, 5 or 6. The reason we organize the survey this way: Perishables largely determine how large a store will be, and the sales it achieves. A store in Group 6, which sells no perishables, looks nothing like a store in Group 1, which is essentially like a Whole Foods Market. When using the data from this survey, only compare your results to the results of stores in your group.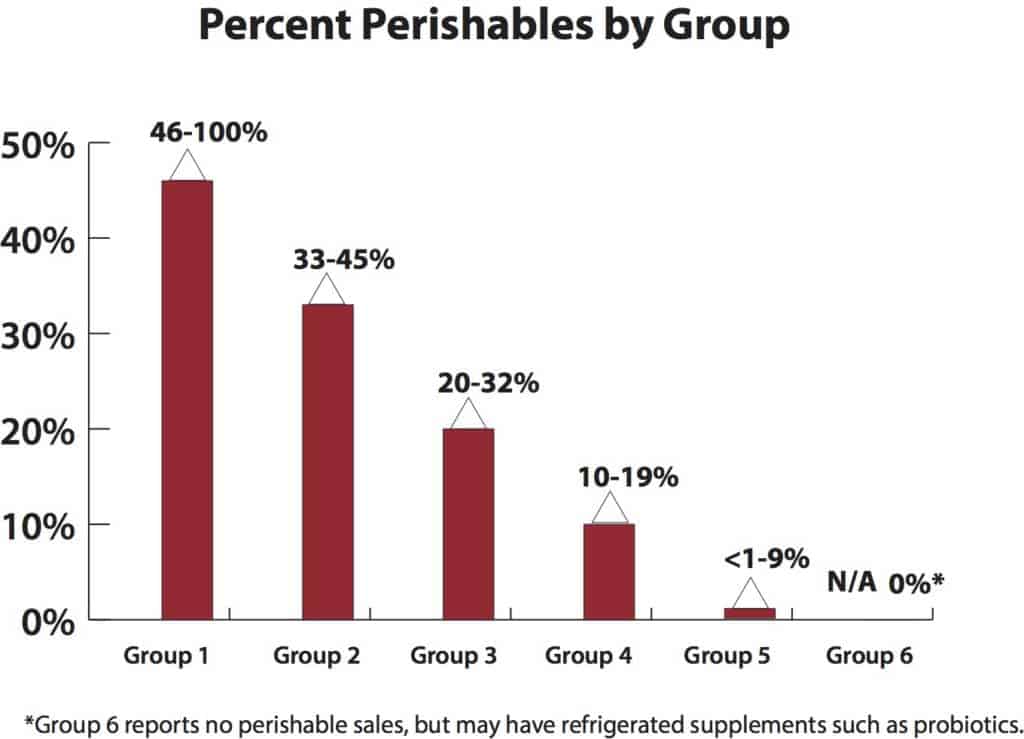
Fresh Perishable Foods Define the Store
This year, two groups increased their perishable sales over 2019, with Group 2 average perishables up 12% (from 37.6% in 2019 to 42% this year) and Group 4 up 18% (from 11.1% in 2019 to 13.1% in 2020). The group with the least perishable sales, Group 5 at 4.7%, was the only group to see a dollar decrease in the category compared to the results Group 5 survey respondents had in 2019—from $51,213 last year to $50,642 this year.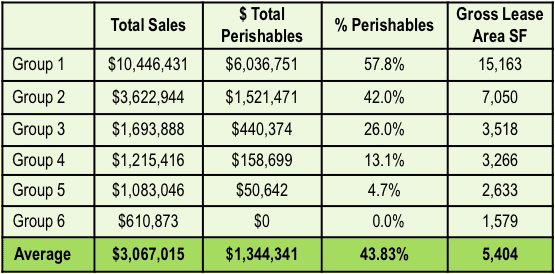
Who Sells What: Percent of Supplements and Perishables Sales by Group
As this survey has shown in previous years, retailers that sell fewer perishables sell more supplements. Group 1 stores sell just shy of 60% perishables and just 5.6% supplements. Group 6 is the reverse, selling 0% perishables and 85.7% supplements.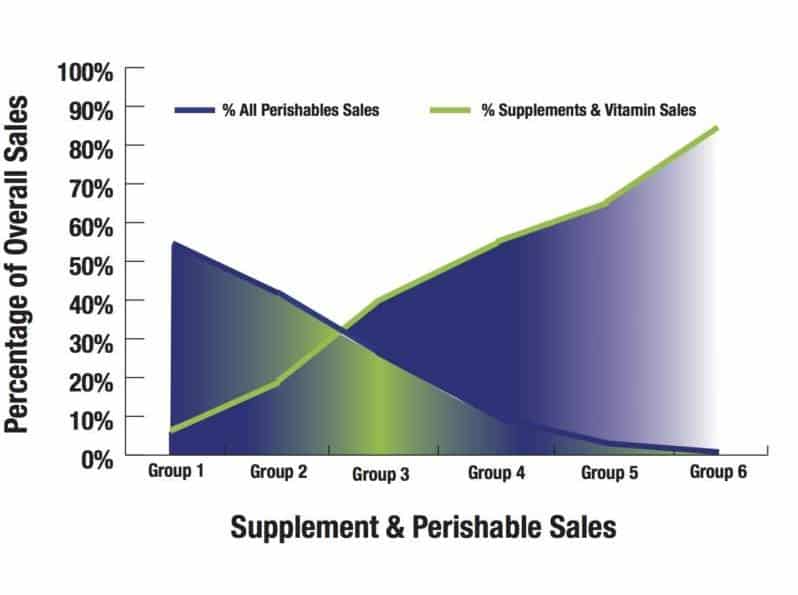
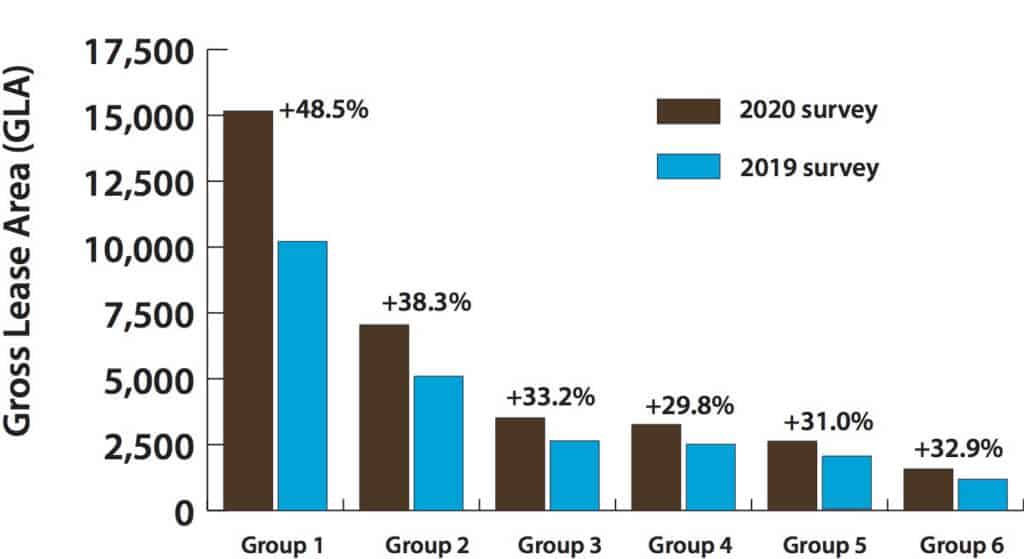
GLA: Sizing Things Up in the 2020 Survey
% Change vs. 2019 Survey Respondents
Looking at Gross Lease Area (GLA), a key distinction with this year’s respondents is that all groups are larger than last year. For example, this year’s respondents in Group 1 were nearly 50% (48.5%) larger than the Group 1 class of 2019.
“Same Store” Sales Growth 2020 vs. 2019
In many measures throughout this survey, we compare this year’s survey respondents to last year’s survey respondents, which consisted of a different group of stores. With the group of retailers that responded this year, store size and total sales in most groups were much larger compared to last year’s respondents. (See Figure 5.) Given that, we also looked at what this year’s survey respondents told us about their sales results compared to last year. Here are the results for “same-store” sales, comparing this year’s respondents’ to their own sales last year. (See Figure 6.)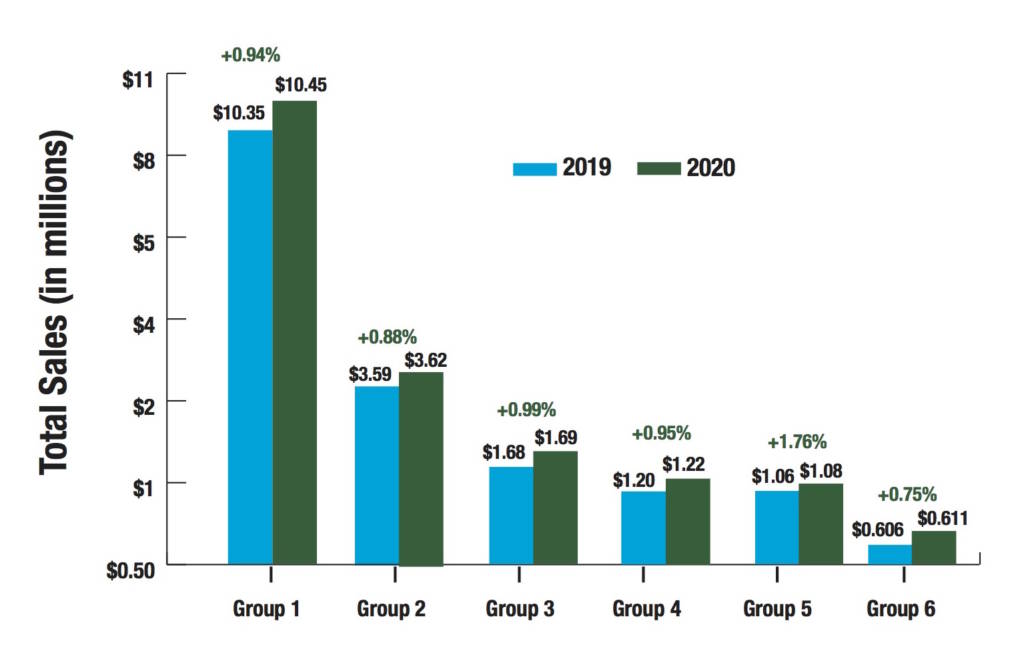
Shopping and Spending
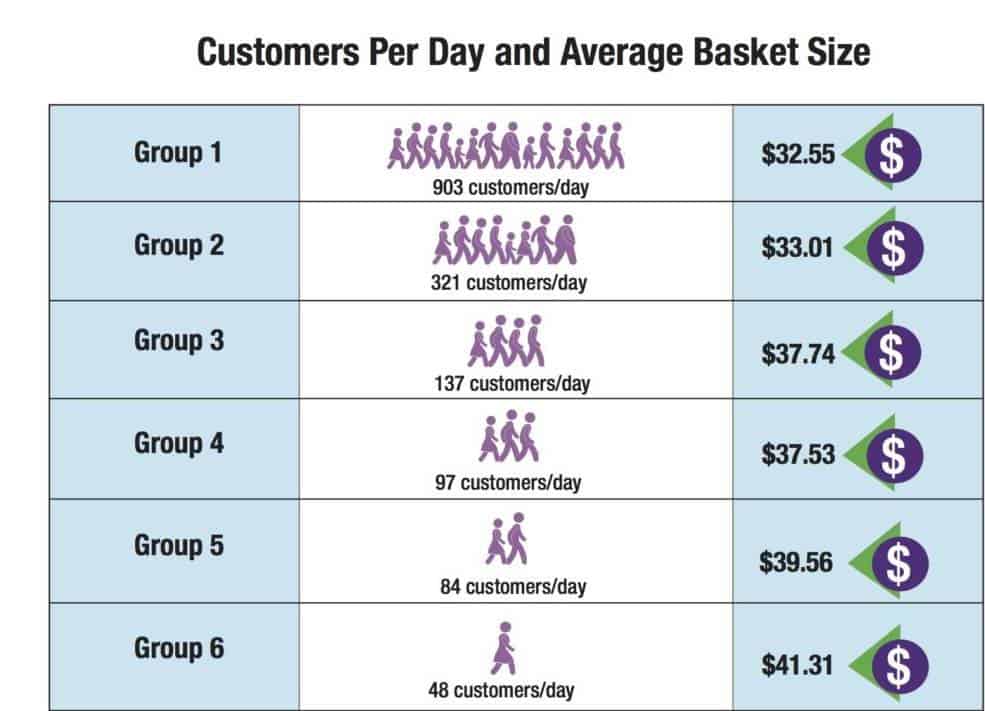
Tracking daily store traffic and average transaction, Group 6 scores the most per average transaction due to the higher cost of supplements compared to foods. Of note: Compared to the results from the 2019 survey, Group 5 average transaction size declined 5.3%, from $41.78 to $39.56 this year. This may be due to Group 5’s 12.5% lower sales vs. 2019 Group 5 respondents. (See Figure 7.)As far as offering online sales, the majority of stores are not going down this path. Nearly seven in 10 (68.1%) of all respondents this year do not sell online. Of those brick-and-mortar retailers that do sell online, 21.7% generated less than 10% of their sales from online purchases.
What's Selling?
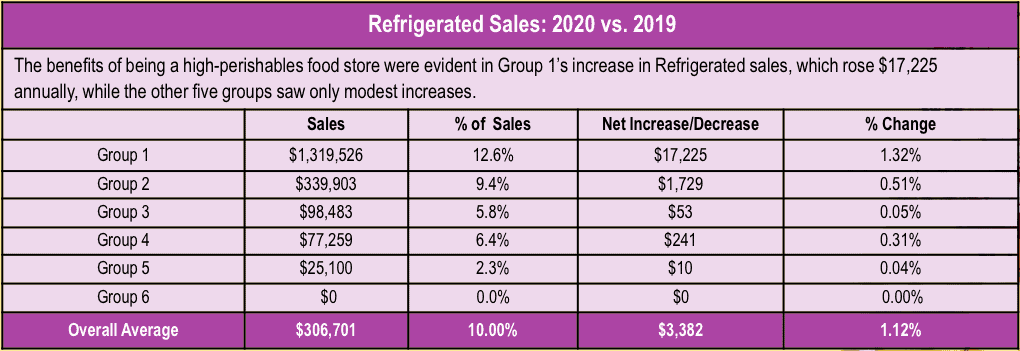
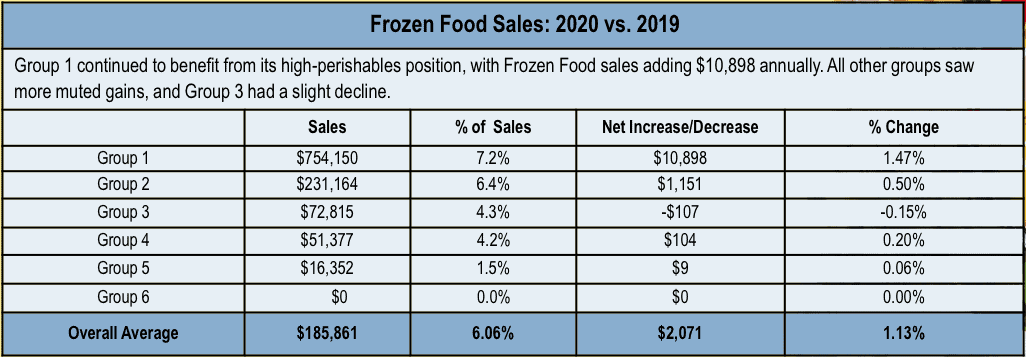
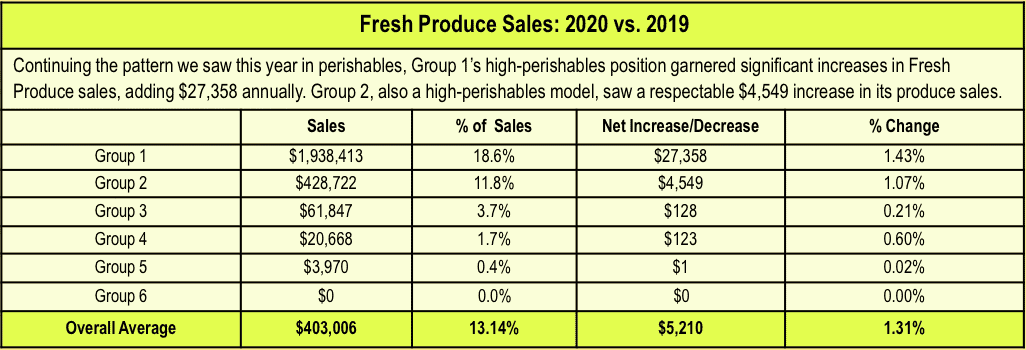
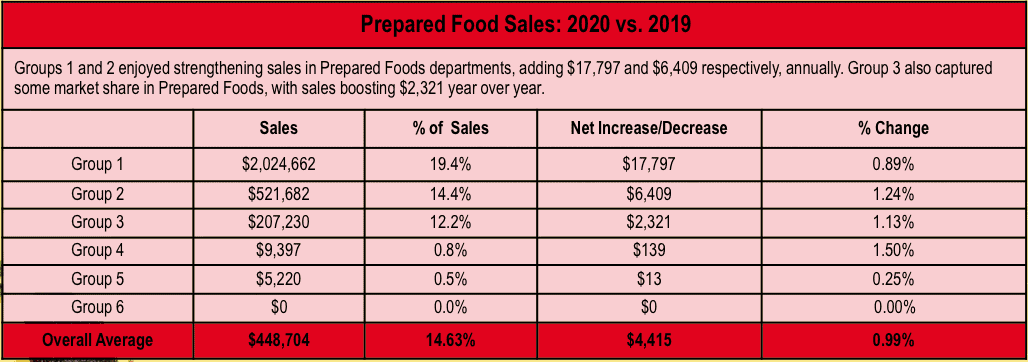
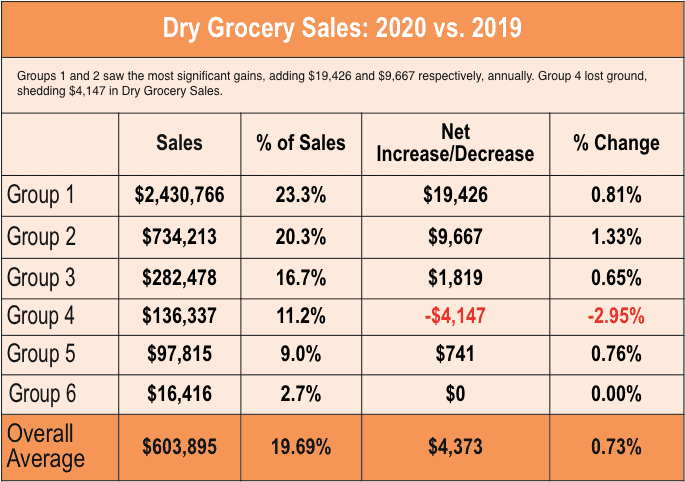
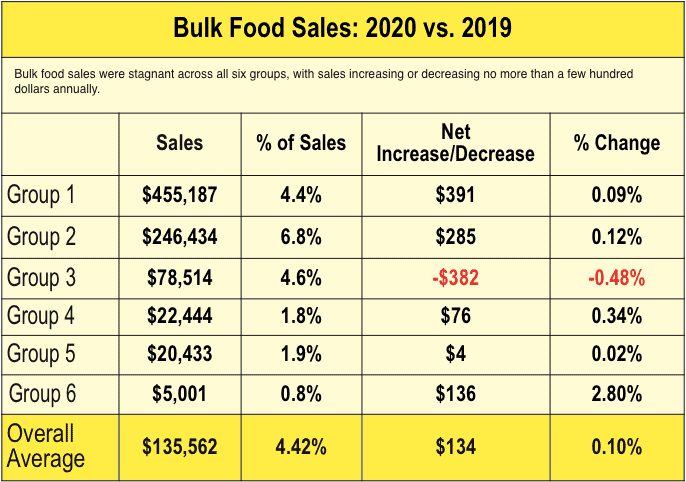
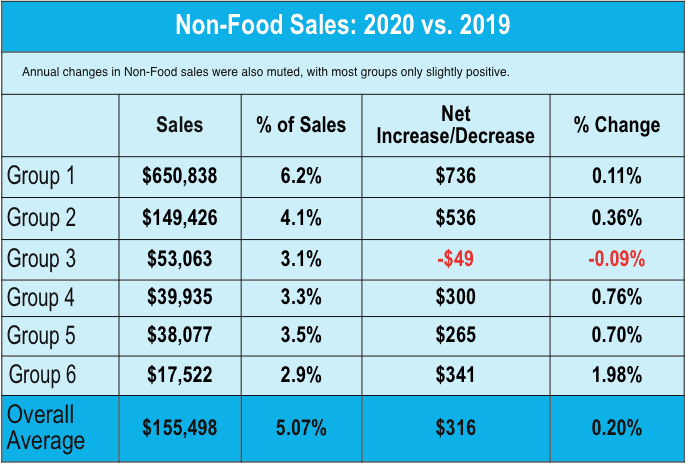
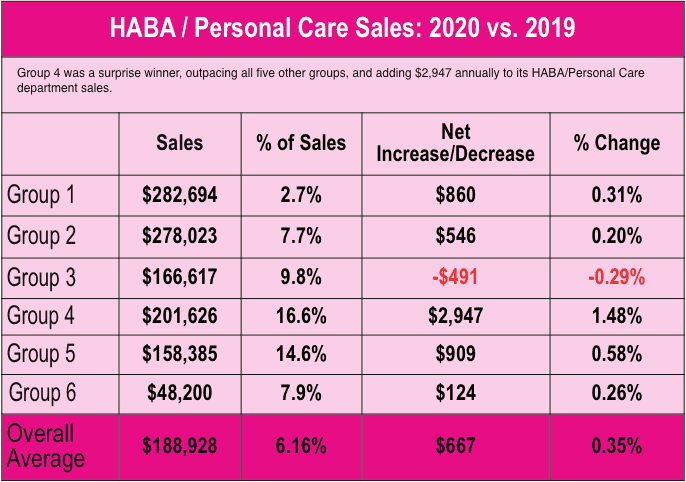
 We asked independent retailers to tell us about their sales results in nine common product categories: dry grocery, refrigerated foods, frozen foods, fresh produce, prepared foods, bulk foods, non-foods, dietary supplements and personal care (HABA). Scroll down for the detailed breakdown by Group. We also asked: Within each category, what one product or product type had the greatest impact on the change in sales your store location experiences? A few trends emerged:
- 42% said CBD/Hemp was impacting sales in the supplement category.
- 29% pointed to local as a sales driver in the fresh produce category.
- 32.1% carry private label supplements (up from 29.5% in 2019). The average number of SKUs is 92.
Average Annual Sales Per Square Foot
We report sales-per-square foot for the total store (Gross Lease Area, or GLA), as well as for the retail-selling area alone, which excludes the non-retail back-room support areas. (See Figure 9.) Sales per square foot this year are lower than last year—using Group 1 as an example, in 2019 sales/SF GLA were $853.38 and sales/SF retail area were $1,281.57. This year, those sales numbers are $688.94 and $931.42, respectively. As noted previously, retailers responding to this year’s survey have larger stores than in 2019. (see Figure 5.)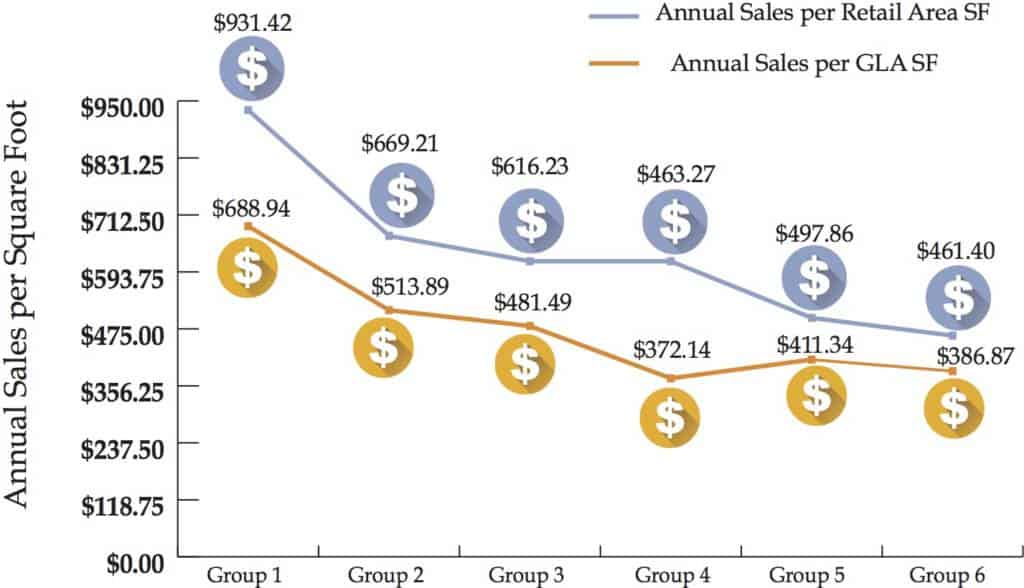
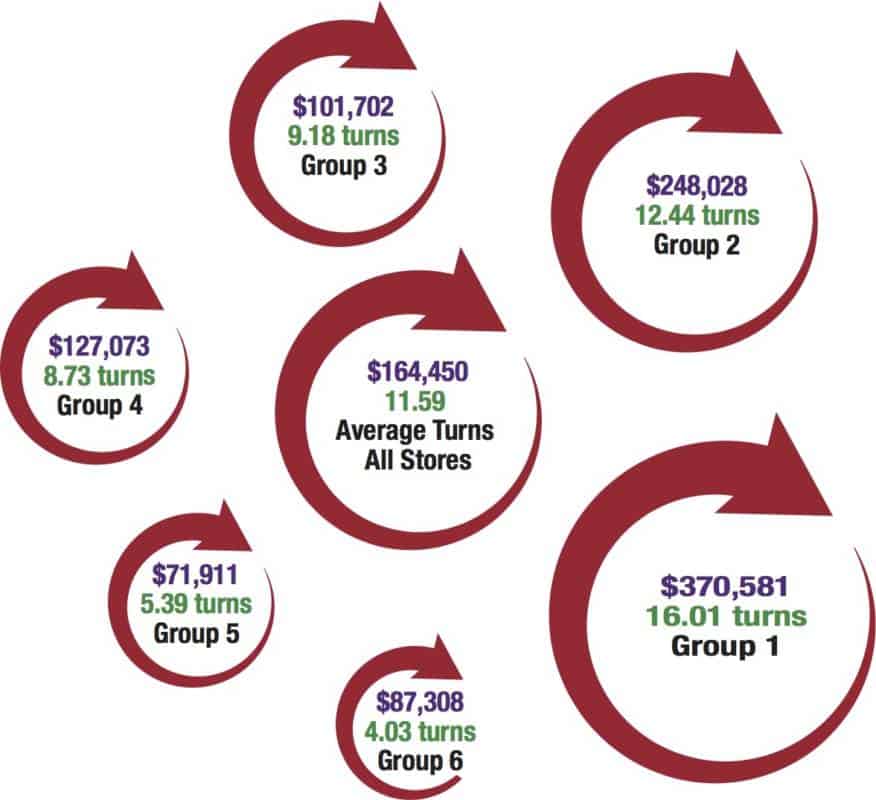
Wholesale Inventory Value & Annual Inventory Turns
Annual inventory turns increase as the percentage of sales from perishables increases. This year, Groups 1 through 4 gained efficiencies, increasing inventory turns compared to 2019. Groups 5 and 6 slowed inventory turns in 2020, perhaps in an effort to stock heavily on the broadest range of supplements.Group 1 respondents in 2020 versus 2019 had higher sales (up to $10.4 million from 2019’s $9 million), turned inventory over faster (16.01 turns vs. 14.98 turns), and had a lower cost of goods (61.81% vs. 62.74%), resulting in a lower average wholesale inventory value this year. (See Figure 10.)
Also of note: Group 2 perishable increased 12% this year (from 37.6% in 2019 to 42% this year), but overall sales increased only 4%, which may explain the increase in wholesale inventory. Group 5 had 12.5% lower sales in 2020 vs. 2019 ($1.08 million vs. $1.24 million), and carried a lower wholesale inventory. And Group 6 had 23.2% higher sales in 2020 vs. 2019 ($610,873 vs. $495,754), and the higher wholesale inventory values along with it.
Investing in Good Employees
Stores with the most perishables sales, as in Group 1, require higher-skilled, higher-paid labor, including culinary professionals. And while labor as a percentage of sales was comparable to last year’s survey, hourly wages decreased significantly in Group 1 ($13.18 this year versus $23.44 last year). (See Figure 11.) Two reasons help explain that $10/hour difference: (1) Stores in Group 1 were 50% larger this year than last, at 15,000 SF vs. 10,000 SF, and 4.95 FTEs/1,000 SF vs. 3.87; (2) This year we changed our methodology for full-time hours to 37.5 instead of the 35 hours we used last year. Also of note: Stores in Group 6 paid less labor as a percentage of sales and in dollars per hour. Looking at Group 6, in this year’s survey, stores were larger than last year’s, at 1,579 SF vs. 2019’s 1,188 SF, which helps explain the lower percentage dedicated to labor. Another possible factor: Owner/operators in the smallest, supplement-focused stores contribute unpaid direct labor, lowering their per-hour labor costs.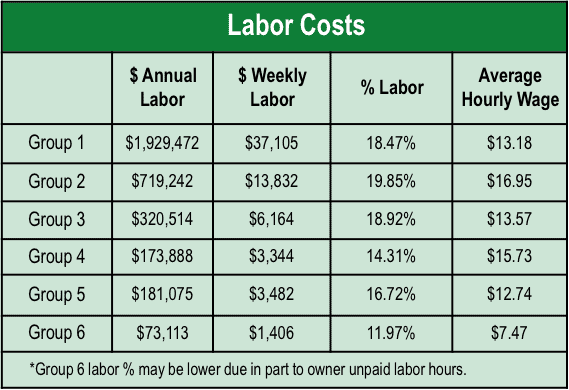
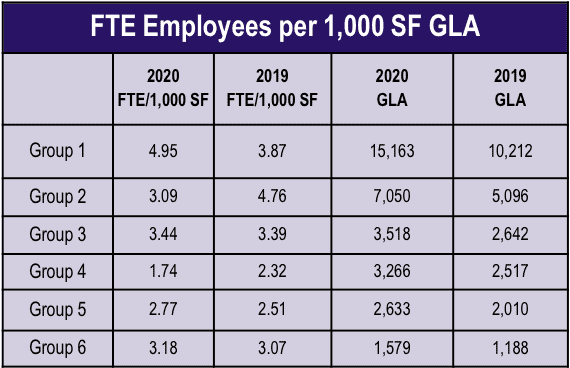
We also looked at the full-time equivalent (FTE) employees per 1,000 SF GLA. (See Figure 12.) Group 1, with 57.8% perishables, needs more labor per 1,000 square feet to run the store. It is also a factor here that Group 1 retailers who responded to this year’s survey, at 15,000 square feet, were 50% larger than last year’s Group 1, suggesting more complex fresh foods departments requiring more FTE employees, at 4.95 vs. 3.87 per 1,000 SF. Group 4 perishables are 13.1%, half that of Group 3’s 26%, helping explain the drop-off in FTEs/SF. Also, Group 4 stores are larger this year vs. 2019, at 3,266 SF vs. 2,517 SF, reducing labor intensity per 1,000 SF to 1.74 vs. 2.32.
Educating the Consumer
 What strategies do retailers rely on to educate and inform?
• In-store product samplings and demonstrations: 73.4% of stores do this. • Social media and blogs: 63.6% • Educational handouts: 62.9% • Email newsletters: 42% this year (up from 35.8% in 2019) • Consumer lectures: 38.5% • Printed newsletters: 36.4% • Online database of nutritional information: 16.8% • Other: 7%
Only 6.3% reported using no supplemental educational materials.
Sales by Department and Year-Over-Year Change
*Data in the following graphs looks at annual change in “same-stores” sales by department for this year’s survey respondents.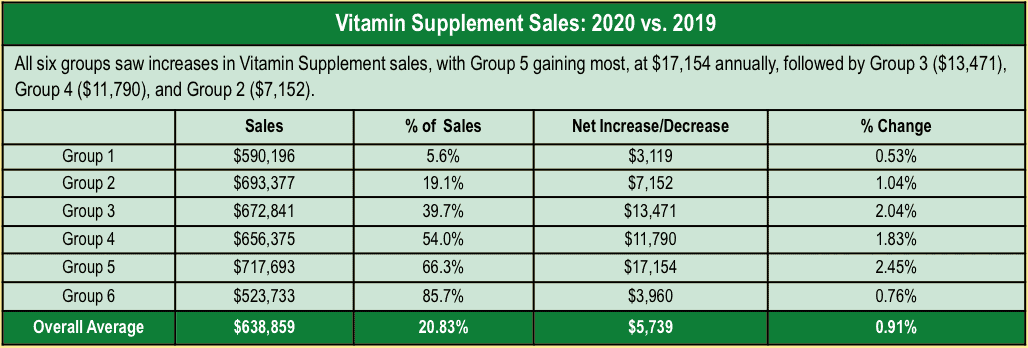
Retail Space vs. Back-Room Support Areas
Perishables require more real estate because back-room support areas must have more walk-in cooler and freezer space, larger areas for preparing food, and more kitchen equipment. This year, Groups 1 through 5 devoted a higher percentage to retail selling areas compared to 2019. The clearest example: In 2019, the ratio of retail to back room SF for Group 1 was 69:31; this year it is 74:26. The reason: In all groups, but especially in Group 1, respondents in this year's survey are larger than the respondents from last year, so they don't need as large a percentage of supper area for kitchens and prep areas as the class of 2019. (See Figure 13.)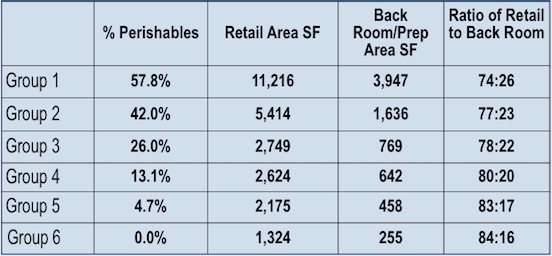
Paying the Rent
The majority of respondents in this year's survey, as in years past, are renters—67% rent, and the other 33% own their real estate. Rent increased as a percentage of sales for Group 1 stores compared to last year, perhaps because these larger stores occupy more expensive, better located real estate. The relatively low overall rent as a percentage of sales, at 4.11%, reflects the mature average age of stores in the survey: 32 years. (See Figure 14.)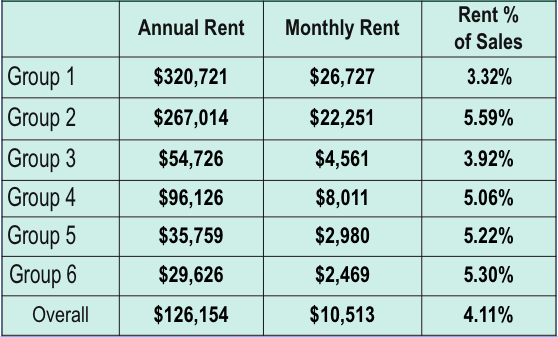
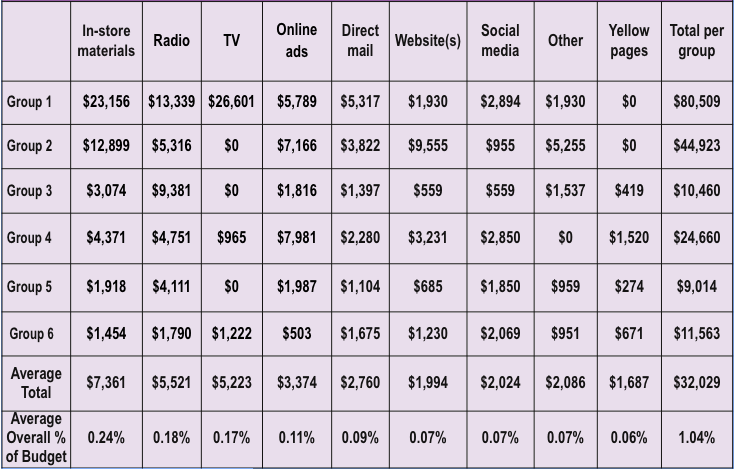
Preferred Marketing Methods—and the Monthly Expense
Most retailers are focusing on their marketing efforts—only 6% reported that they make no effort to advertise or promote. In terms of preferred methods, 75.8% use social media. One retailer in Oregon shared: "Social media has been our most successful advertising, virtually costing but the time our dedicated employee puts into delivering it... Four platforms—Facebook, Pinterest, Instagram, and Twitter—reach a local audience when we pay for a particular post in a set area, set length of time, and set amount. We have actually garnered co-op dollars to help with that advertising. Print ads are very expensive and not very effective. Radio, meh... TV, too expensive."The percentage of respondents using other top marketing methods: 70.5% use in-store materials; 59.7% have a website(s); 29.5% have radio promotions; 24.8% run online ads; 22.8% use direct mail; 13.4% use the yellow pages; and 8% have TV ads—plus another 24.8% also use other outreach methods.
In terms of money invested in these strategies, overall stores spent an average of $32,029 annually on all marketing efforts, with overall annual spending on marketing at just over one percentage point (1.04%). As you would expect, Groups 1 and 2 spent the most on marketing annually—$80,509 and $44,923, respectively. (See Figure 15.)
The Bottom Line: Net Profits
While net profit percentages were smaller in the larger stores this year, net profit dollars were greater compared to the smaller stores. Retailers in all 6 groups shaved off net proffit percentages compared to survey respondents in 2019: from -0.27% in Group 4 to -1.43% in Group 5. But, real dollar profits increased in all groups except 2 and 5. (See Figure 16.)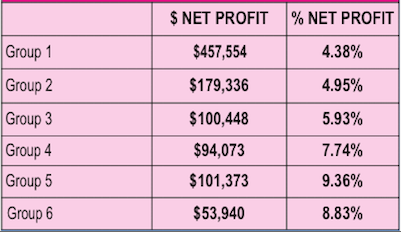
Pro Forma Profit & Loss
We assembled pro forma Profit & Loss (P&L) statements for each of the six groups. This year’s respondents retained an average 14.86% for all other expenses after labor, rent, and marketing, suggesting they have the strength to weather the increasing pressures from online and bricks-and-mortar competition. Group 6 was the only one to see a significant decrease in gross profit margins from last year. Overall, GPM increased in 2020. (See Figure 17.)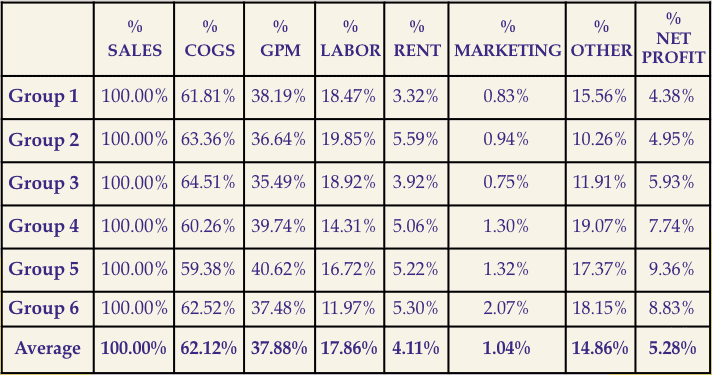
Where the Growth Is
About one in six respondents (15%) expanded last year. The average expansion was 2,165 square feet, at an average cost per square foot of $71. Vitamins, herbs and supplement departments were the most popular growth area last year, making up 15% of all expansions, followed by HABA, non-foods, household and pet, at 12% each. Juice bar/café/deli/bakery/prepared foods/grab-and- go made up 10% of all department expansions, with refrigerated, dry bulk foods, and services/practitioner areas each accounting for 8.5% of all expansions, respectively. Frozen food, fresh produce and dry grocery departments each got the expansion treatment in about 7% of all expansions.Plans for future expansions and remodels: 16% of respondents plan to expand or remodel in the current year. The average expansion planned for this year is 1,500 square feet at an estimated cost per square foot of $83. Retailers will give the expansion treatment to the juice bar/café/deli/bakery/prepared foods/grab- and-go department in 15% of all expansions. Also, 15% of expansions include the vitamin, herb and supplements department, and 15% include personal and body care departments. Dry bulk foods are on the docket in 11% of all expansions, followed by refrigerated foods, fresh produce departments, and services/practitioner areas each in 9% of all expansions. Dry groceries will expand 4% of the time, frozen foods, non-foods, household and pet areas 3% each, and other departments, in 2% of all expansions.
There are also new stores: 4% of respondents added one store last year, and 1% added two stores. For the coming year, 5% of respondents plan to add one store, and one respondent plans to add three stores.
Sound off!
We asked our survey respondents to comment on any aspect of business, from their most pressing concerns to their plans for the future. Some of the concerns that were shared:“We are in an agricultural area and the president’s tariff war has killed the economy in our state...since he took office our sales have decreased by 52%.”
“Playing guessing games with the economy and the volatility that the current administration is providing through tariffs and preventing workers from entering the country.”
“Battles of the big stores selling items that started and were meant only for the Natural industry. [I’m] so frustrated to see how it’s harder to keep loyal customers. I hope someone addresses this issue. We are working hard to save our industry.”
“Just trying to stay open amid all the competition—Amazon, Whole Foods, Wegmans…”
“Amazon is a direct problem. People are using it more.”
“The more the big companies get involved, the worse it gets for the little guy.”
Respondents touched on how hard it is for brick and mortar to compete with online pricing and showrooming:
“Going more towards private label because of online sales from companies we carried for years...We are planning to sell mostly our brand and companies that are loyal to us.”
“[I] notice more ins and outs—no purchase—probably shopping price against internet price.”
For some, such pressures have been too much to overcome:
“We actually closed our business in June 2019 due to severe reduction in sales due to local presence of big box stores and extreme competition with online retailers. Am currently attempting an online presence but might retire completely.”
That said, some retailers are seeing a promising shift:
“Our online business is bigger than our retail business, although retail has grown more this year than online.”
“We’re seeing vendors cut back on their discounting. Online sales continue to present a challenging obstacle, but don’t seem to be moving too fast yet.”
And what about CBD—has it been the game-changer many hoped it would be? It depends on who you ask.
“I feel my business has gone down. Everyone thinks CBD does it all.”
“We have updated the store and the energy is very positive! We remove products from our inventory that sell out to big companies and [we] stay informed. CBD has been a great hit and we only bring in the lines that we have investigated and have worked for us! Our customers can count on us to give them the real scoop!”