
Sponsored by
Some background to keep in mind as we dive deeper into the findings: Each year, a changing group responds to the survey, but the general finding that perishables determine a store’s size and sales remains true (see Figures 2 and 3). This year, many more stores in the lowest and highest perishables groups responded to the survey. As a result, on average, stores in this year’s survey had smaller footprints, and lower total sales, but comparable sales per square foot, as last year’s survey. Another key point: High-perishables stores lost prepared foods sales due to the pandemic, but retained produce, refrigerated, frozen, and dry grocery sales.
In addition to comparing each year’s survey respondents to the prior years’ respondents, we also ask retailers to tell us how they did compared to their own “same-store” sales compared to a year ago. So how did retailers fare during the survey period of July 2019 to June 2020 as the global pandemic added to the existing pressures such as competing with big box stores and online retailers like Amazon? The sales growth seen by this year’s survey respondents was just over five percent (5.02%), driven by strong increases in fresh produce, supplements and vitamins, and dry packaged groceries. Overall average total sales for all groups in the survey were $2,218,053, and overall average year-over-year growth was $111,349, up 5.02%. But that’s an average—some groups fared better than others, as you will see over the course of this survey.
Looking beyond our survey, sales from all U.S. independent natural retailers in 2020 rings in at $11.3 billion, which is a small piece of the $92.8 billion pie of total natural organic sales through all eight retail and food-store channels (including supernaturals such as Amazon Whole Foods Market and Sprouts Farmers Market; conventional supermarkets; mass merchandisers; pharmacies; and vitamin chain stores) in 2020 (see below). For a complete update of the U.S. natural organic retail market, see the Retail Insights® 2021 Retail Universe for U.S. Premium Natural, Organic Food, Supplement & Personal Care Sales.
 Now, let’s look at the detailed survey findings, so you can see how your store stacks up. Questions? Send them to editor@wfcinc.com. Jay Jacobowitz and Maggie Jaqua will be discussing key findings from the survey and answering your questions in a webinar, which, along with this year’s survey, is sponsored by Nutrasource. Stay tuned for details!
A Look at the Respondents
For 43 years, WholeFoods Magazine has been surveying independent natural organic retailers on the state of the industry, providing valuable data that helps inform business decisions and sets you up for greater success in 2021 and beyond. Once again this year, WholeFoods partnered with Readex Research to gather results for the 12 months ending in June 2020. To all those who participated in this year’s survey, thank you for carefully and completely filling out the questionnaire. Your responses help us provide what we believe is the most accurate picture of independent natural products retailing in the U.S. today, with information that natural products retailers can use to measure and improve business.
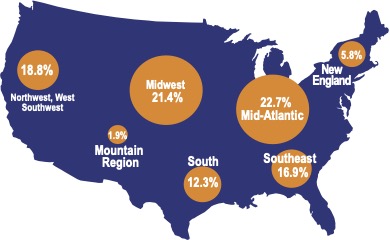
As in previous years, respondents to this year’s survey represent nearly every size and from every region of the country, giving us an in-depth picture of the industry (see figure 1).
- Large towns/rural areas (population of less than 50,000): 32.5%
- Small cities (population of 50,000 – 99,999): 24.7%
- Medium cities or suburbs (population of 100,000 – 299,999): 21.4%
- Large cities or suburbs (population of 300,000 – 999,999): 10.4%
- Major metro areas (population of more than 1 million): 11%
- 76% of respondents operate one store, while 16% operate 2 to 6 stores and 8% operate 7 or more stores.
- 65% of respondents’ stores have never changed hands, and average 29 total years in business.
- 11% of respondents’ stores changed hands in the last 10 years, and average 30 total years in business.
- 24% of respondents’ stores changed hands an average of 18 years ago, and have been in business an average of 44 total years.
- 69% rent their space, and 31% own the real estate.
Retailers: Here’s How to Get the Most Out of This Survey
Start by tallying up your sales from four main perishable fresh-foods departments: refrigerated, frozen, produce and prepared foods. Once you find what percentage of your total sales these four categories represent, you can compare your results to similar stores in your corresponding Group—either Group 1, 2, 3, 4, 5 or 6. Why do we organize the survey this way? Perishables largely determine how large a store will be, and the sales it achieves. A store in Group 6, which sells no perishables, looks nothing like a store in Group 1, which is essentially like a Whole Foods Market. When using the data from this survey, be sure to compare your results to the results of stores in your group.
Fresh Perishable Foods Define the Store
Our class of 2021 independents sold a similar amount of perishables as 2020 survey respondents: 41.2% of total sales this year vs. 43.8% last year.
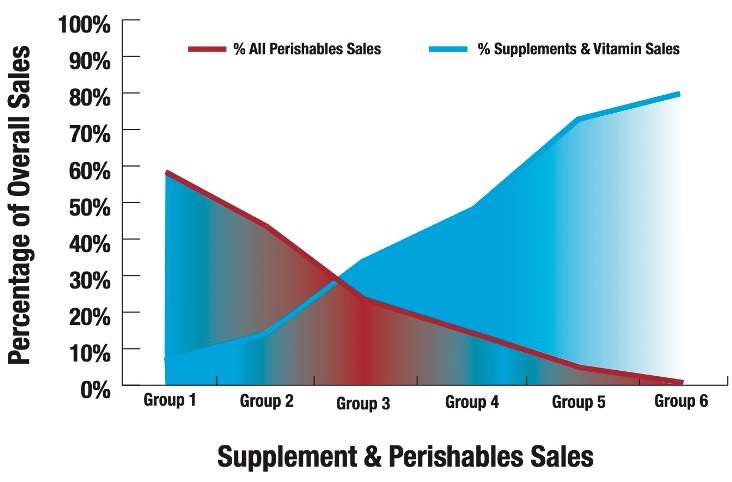
Two Worlds: High Perishable Stores; High Supplement Stores
As in previous years, stores that sell a lot of perishables foods sell few supplements and vitamins as a percentage of sales. The opposite is also true: Stores that focus on supplements sell little to no perishables.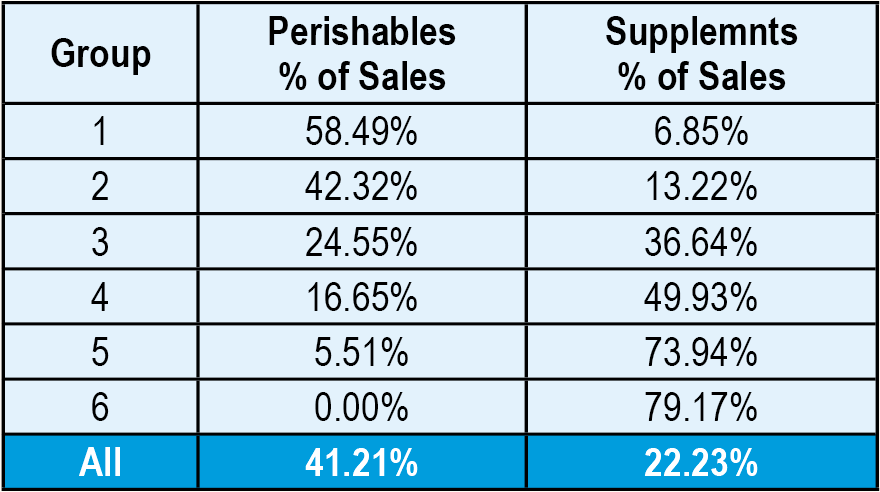
What’s Selling?
Independent retailers told us about their sales results in nine common product categories: dry grocery, refrigerated foods, frozen foods, fresh produce, prepared foods, bulk foods, non-foods, dietary supplements, and personal care (HABA). See figures 13A and 13B for details. We also asked respondents to share what one product or product type had the greatest impact on their store location’s change in sales.
62% of those who weighed in here called out general immune boosters or specific ingredients such as elderberry, vitamins C and D, and zinc in the supplements and vitamins category.The COVID effect was also seen in the HABA and household categories, with retailers calling out hand sanitizers, hand soaps, toilet paper, paper towels, and sanitizing sprays.
57% now carry private label, up from 33% in prior years....and what’s not selling: Several retailers called out the lack of availability of inventory, including meat products, as well as the negative impact of prepared food departments closing due to COVID.
GLA: Sizing Down in the 2021 Survey % Change vs. 2020 Survey Respondents
This year’s survey respondents worked from smaller gross lease areas (GLA); just about three-quarters (78%) of the size of 2020’s survey respondents, with an average 4,212 square feet GLA this year compared to 5,404 square feet GLA last year. The largest change occurred in Group 1, where GLA averaged 10,509 square feet this year versus 15,163 square feet last year. Respondents that fell into Group 2, our second-highest perishables stores, grew in average size this year to 9,408 GLA compared to 7,050 in Group 2 last year.
2021 vs. 2020 Total Sales & Annual Sales Per Square Foot
Although average gross lease area (GLA) came down in this year’s survey compared to last year’s, annual sales per square foot were remarkably similar. Sales per square foot varied in 2021 vs. 2020, in a range of 8 percentage points below (Group 3), $443.40 this year vs. $481.49 last year, to 4 percentage points above (Group 4), $388.82 this year vs. $372.14 last year. The similarity persisted for annual sales per square foot in the retail area, as well (see Figure 9).
Shopping and Spending
Customers per day increase with store size and percentage of fresh, perishables foods, ranging from 36 per day in stores that sell no perishables, to 472 per day in stores that get at least 50% of sales from perishables. Average basket size ranges from $35.26 in Group 4 to $43.07 in Group 1, our high-perishables food stores. Group 4, with 11% to 20% of sales from perishables, and 2,300 square feet GLA on average, are perhaps neither large enough, nor carry enough fresh foods, to attract a daily grocery clientele, helping explain their low average basket size. It helps to focus on supplements and vitamins, as we can see from Group 5’s results. These stores average 1,900 square feet, generate 60 customers per day, and average $41.20 per transaction.As far as online goes, 61% did not sell online. Of those brick-and-mortar retailers that do sell online, 23% generated less than 10% of their sales from online purchases. Those that got 10% to 19% of sales online, and those getting up to 100% of sales, made up 8% each of all respondents.
Overall, 58% of respondents’ stores are open six days or fewer per week, with 42% open seven days. This comports with our respondents being mostly single-store independent retailers, in locations that often do not require seven-day operation.

How Stores Deliver Products
Compared to last year’s survey, more stores are delivering direct and through 3rd parties (9.8% last year, versus 20% in the current survey.) Last year 40% of respondents noted that they offered no delivery—this year, that number is down to 34%. Also notable: In the last year, 40% promoted online ordering and 39% promoted home delivery. By contrast, nearly all (86%) promoted in-store pickup. Only 6% of respondents didn’t promote any of these ordering/delivery methods.- Deliver direct: 36%
- Don’t deliver: 34%
- Deliver direct & through 3rd parties: 20%
- Deliver through 3rd parties: 10%
Average Annual Sales per Square Foot
We report sales-per-square foot for the total store (Gross Lease Area, or GLA), as well as for the retail-selling area alone, which excludes the non-retail back-room support areas.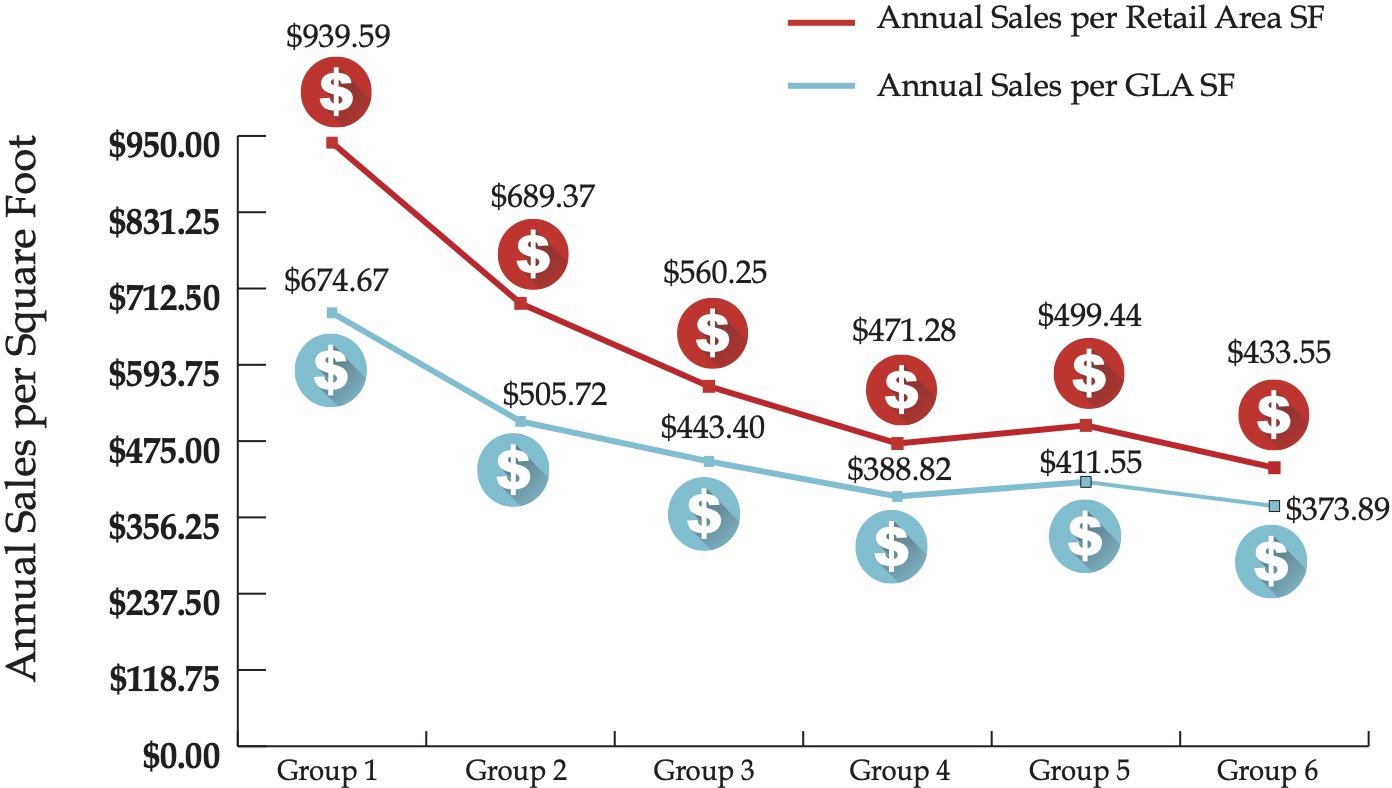
Retail & Wholesale Inventory Value & Annual Inventory Turns
The more foods you sell, the faster you turn your inventory over. Stores in Group 1, our highest perishables stores, crank inventory over 18.27 times per year; slightly less than once every three weeks (20 days). Bookkeepers and accountants may complain, but supplements stores in Group 6 take nearly two-and-a-half months (73 days) to sell through inventories, or just 4.99 times per year.
Education & Outreach
As COVID-19 concerns spread across the nation, what strategies became more important than ever for retailers to educate and inform? Retailers continue to favor real-world, physical merchandising methods, with in-store sampling and product demonstrations topping the list in nearly three in four (73%) stores. More than half (58%) of stores use social media and blogs, and nearly half (46%) email newsletters to their customers. About one in five (19%) rely on online databases of nutritional information.• In-store product samplings and demos: 73% • Educational handouts: 61% • Social media and blogs: 58% • Email newsletters: 46% • Printed newsletters available in store: 39% • Consumer lectures: 36% • Online database of nutritional information: 19%
Only 7% reported using no supplemental educational materials.
Investing in Employees
As you might expect, stores with lots of fresh foods departments require more staff with more complex skill sets. These folks make more money than general retail help. So we see, with hourly wages pushing $19.00 per hour ($18.89) in Group 1, our high-perishables stores, and drifting down to $12.56 per hour in the supplements-focused stores in Group 6. Likewise, labor as a percentage of sales increases as the complexity of the food operation increases, climbing from 13.03% of sales in stores with zero perishables, to over 19% for high-perishables stores in Groups 1 and 2. (See Figure 11.)
We also looked at the full-time equivalent (FTE) employees per 1,000 SF GLA. (See Figure 12.) It apparently is more efficient to run a 10,000 square foot store than a 15,000 square foot store—the difference in GLA in Group 1 this year vs. last year—even if you sell a lot of perishables. This year, stores in Group 1, averaging 10,000 square feet, with at least 50% of sales from perishables, needed 3.53 full-time-equivalent (FTE) employees per 1,000 square feet, vs. 4.95 FTEs in Group 1’s 15,000 square foot stores last year.

Investing in Growth
Last year, 14% of respondents remodeled or expanded. The average expansion was 800 square feet, and the cost to remodel or expand ranged from $17.60 to $83.36 per square foot.- Frozen foods topped the list of departments retailers expanded last year, with two thirds (66%) of those who remodeled or expanded including frozen foods.
- Supplements, vitamins and herb departments were also among the most popular remodels or expansions, included in two of three (66%) projects.
- Juice bar, café, deli, bakery, prepared foods, and grab & go were part of retailers’ remodels and expansions, making it into half (50%) of all projects.
- With the pandemic, a portion of these prepared-foods remodels included removing self-serve hot, cold, and salad bars.
- Refrigerated foods were also important in remodels and expansions, making up half (50%) of all projects. Also pandemic-driven, refrigeration remodels added grab-and-go cases to help offset prepared-food declines in in-store dining.
- Fresh produce, dry grocery, personal care, body care, and cosmetics departments got remodeled or expanded in one of three (33%) projects.
- Retailers continued to value in-store services, expanding or remodeling service and practitioner areas a third (33%) of the time.
- Dry bulk foods, bulk herbs, non-foods, household, and pet products were included in 17% of all projects.
- Juice bar, café, deli, bakery, prepared foods, grab & go departments top the list of planned remodels or expansions, figuring in 66% of all projects. These prepared foods changes reflect pandemic-driven shifts in shopper buying habits and government limitations on in-store dining capacities.
- More than half of retailers (56%) plan changes to fresh produce departments, one of the categories that has seen increased purchases from consumers newly concerned about a healthy diet.
- Nearly half (44%) of all remodel and expansion projects will include frozen, refrigerated, dry bulk, supplements, and personal care departments.
- Service and practitioner area remodels and expansions are also going to be popular in nearly half (44%) of all projects.
- Dry grocery departments will get the remodel or expansion treatment in 34% of projects.
- Non-foods, household, and pet products figure in about one in five (22%) of all projects.
Looking back…
Survey respondents told us their results through mid-year; the 12-month period ending June 30, 2020. This period includes the beginning of economic shutdown in March, and the initial surge in shoppers hoarding household essentials, such as cleaning and disinfecting products. Natural products stores in particular, which most states ruled were essential businesses that could stay open, also saw an initial increase in supplement and vitamin sales, as anxious shoppers looking to boost immunity sought advice and supportive products. As of the end of June, 2020:- 41% of stores had increased total sales
- 37% of stores stayed about the same
- 22% of stores registered sales declines
Among the stores that reported a decline, the median decrease was 13%
Looking ahead…
Optimism reigns for the current year, 2021:- 33% of stores believe sales will increase
- 61% believe sales will hold steady
- 6% believe sales will decrease
Among the stores expecting a decline, the median decrease forecast is 10%
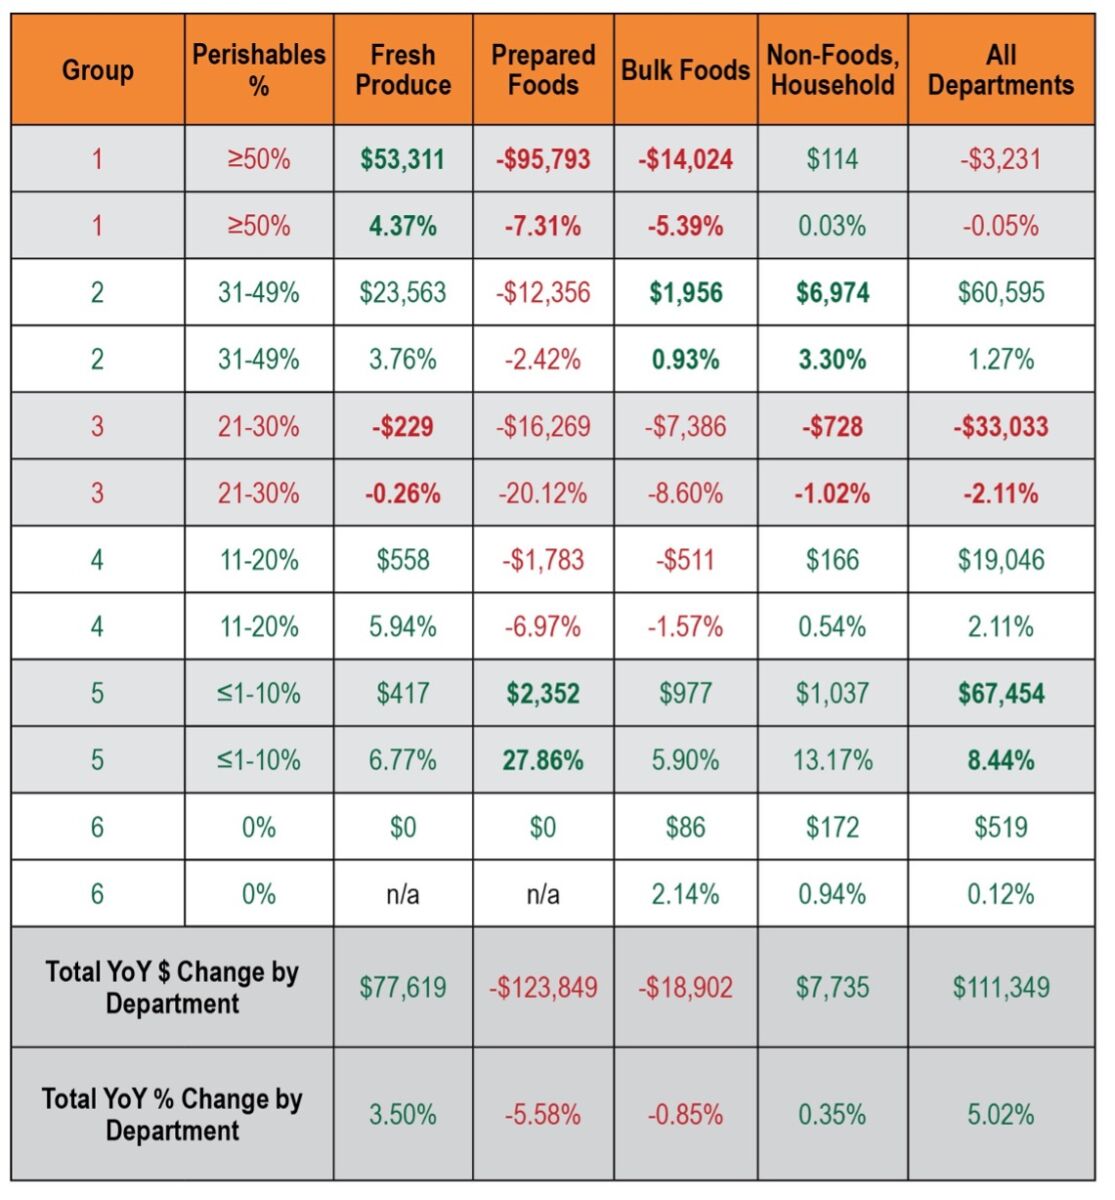
Same-Store Sales: Year-Over-Year $ and % Change, By Department and Store Group
In addition to comparing each year’s survey respondents to the prior years’ respondents, we also ask retailers to tell us how they did compared to their own “same-store” sales compared to a year ago. Overall, seven of the nine product categories we track increased. Two departments, prepared foods and bulk foods, decreased. Prepared foods suffered from state-mandated shutdowns and limits on indoor dining, while bulk foods departments shut down due to sanitization issues with shared implements, such as scoops and bulk bin feeder handles.Taking a closer look: Groups 1 and 3 had net declines in total sales for the 12 months ended June 2020, compared to the 12 months ended June 2019—a consequence of these high-perishables stores losing prepared food sales. Group 3, our “mid-perishables” stores, with 21% to 30% of sales from fresh foods, suffered the greatest overall year-over-year declines; down an average $33,033 (or -2.11%). Group 3 lost sales in eight of the nine product categories we track, and in five of the nine categories, had the largest losses compared to the other five store groups. At 3,500 square feet GLA on average, Group 3 stores are far smaller than the 10,000 and 9,000 square foot stores in Groups 1 and 2, and in shoppers’ minds, may not be large enough to qualify as full-line grocery stores.
Because of the pandemic shutdowns, high-perishables stores with large prepared foods departments took a big hit. Stores in Groups 1, 2 and 3 were burdened with more complex menus, hot, cold and salad bars, which had to be shut down during the pandemic, losses from which overpowered any shift in merchandising to grab-and-go cases.
Group 1 stores lost the most in prepared foods departments, an average $95,793 sales decline (or -7.31% of total sales). However, Group 1, at 10,000 square feet GLA, appears to be large enough to qualify in shoppers’ minds as a full-line grocery store. Group 1 packaged dry, refrigerated foods, frozen foods, and fresh produce departments all increased in sales, we assume because shoppers saw these departments as healthy and safe.
Many stores said they suspected, after an initial March 2020 surge in panic buying of elderberry, multivitamins, vitamin C, zinc, and other immune support products, that customers shifted their buying online for supplements.
Supplements-focused stores in Group 5, with the lowest percentage of sales from perishables (≤1% to 10%), and a large majority of sales from vitamins and supplements (73.94%), were able to maintain robust supplement sales. Stores in Group 5, which average 1,900 square feet, grew supplement sales by $54,661 on average, a 9.25% department increase, which propelled an overall sales increase of 8.44%, or $67,454. Group 5 had increased sales in all nine product categories we track, including the prepared foods department, which delivered a $2,352 average increase per store in Group 5. We believe Group 5 was able to increase prepared foods sales because their menus are generally modest; mostly sandwiches and soups, which were easily converted to grab-and-go refrigerators as in-store dining shut down.

Pro Forma Profit & Loss
This year’s survey respondents demonstrated strong, stable earnings and good cost control. Cost of goods increased as a percentage of sales as the percentage of perishables increased. Likewise, cost of labor rose as operations became more complex by adding perishables departments. Rent was remarkably consistent in the 4% range, but keep in mind, the average age of stores in the survey is nearly 30 years old, permitting mature sales levels, and favorable long-term leases. Marketing dollars and as a percentage of sales increased over prior years’ surveys, perhaps because of more consistent, and necessary spending to make an impression on shoppers in the virtual as well as real world. Net profits generally grew as a percentage of sales as perishables sales decreased. This is understandable for the reasons we mentioned earlier: Stores focused on non-perishables have a lower cost of goods and cost of labor, raising net profit percentages, although not absolute dollars. Even though high-perishables stores bring a lower percentage profit to the bottom line, their larger total sales deliver much bigger dollar profits compared to supplements-focused stores.
Retail Space vs. Back-Room Support Areas
The more perishables a store sells, the more back room non-retail support area it needs for walk-in coolers and freezers, produce preparation areas, receiving and storage. Groups 1 and 2, our high-perishables stores, need over one-quarter of their total GLA, 28.2% and 26.6%, respectively, for these back-room support functions. Once perishables fall to 20% or less of total sales, as in Groups 4, 5 and 6, the need for back-room support area also falls below 20% of total GLA.
Paying the Rent
As in prior years, respondent stores' mature average ages allow them to reach relatively high sales volumes, and to negotiate favorable long-term leases. Rents as a percentage of sales cluster in the 4% range—very affordable compared to what a new store would likely pay as a percentage of sales in its early years.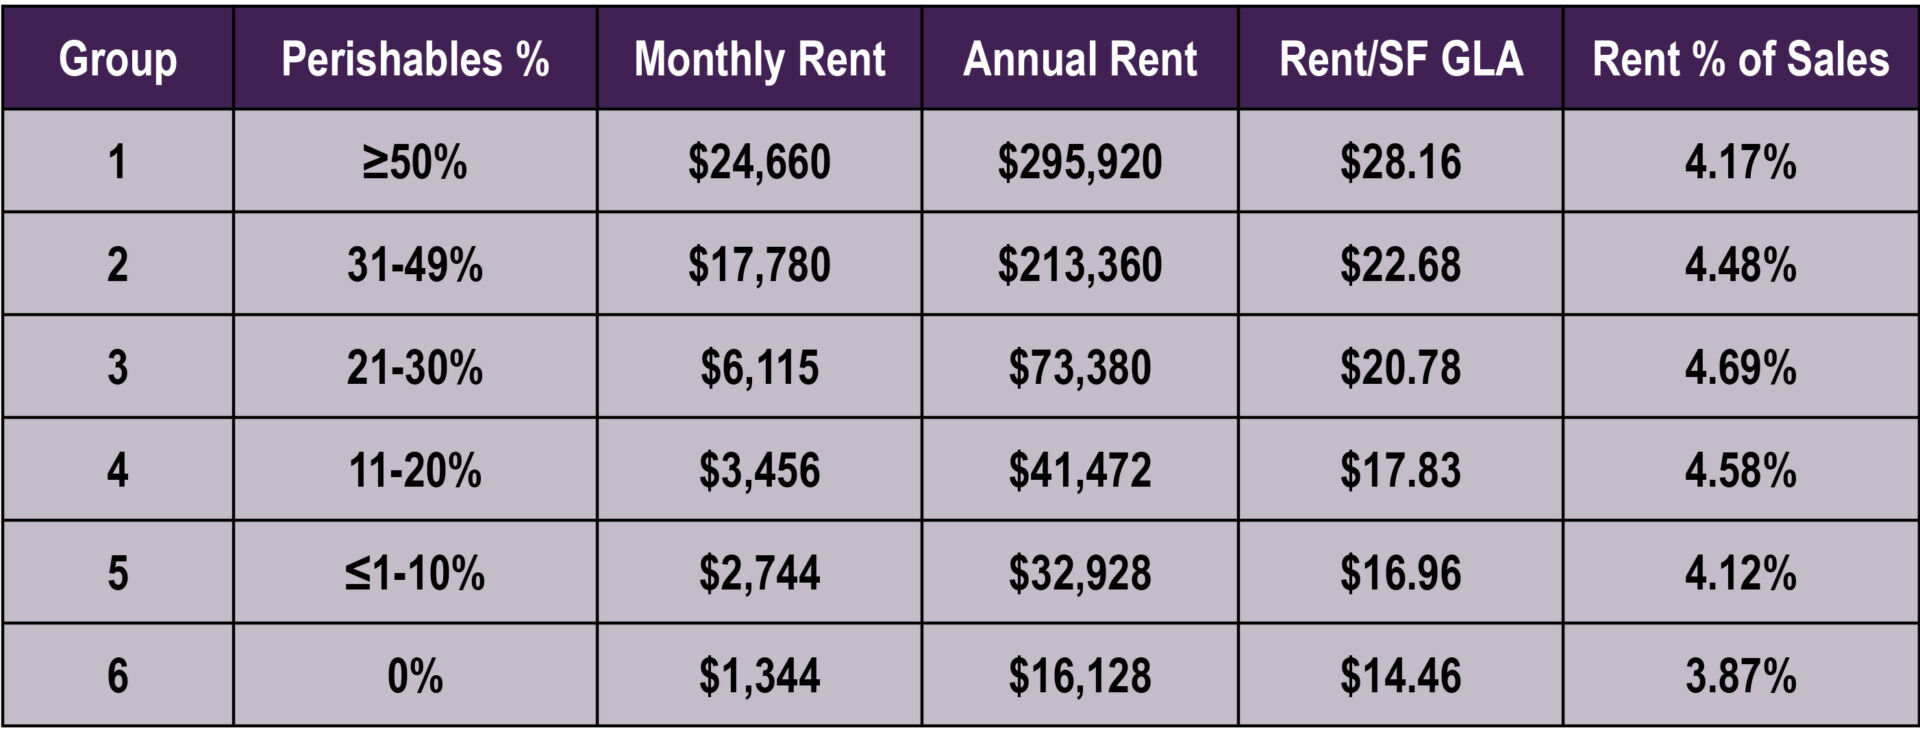
Embracing Private Label
Many more stores have adopted private label supplements and vitamins compared to prior year's surveys. Nearly six in 10 (57%) now carry some private label, up from about 33% in prior years. Many stores appear to be just starting (42%), carrying up to about two dozen SKUs:- 42% carry up to 24 SKUs
- 33% carry 25-99 SKUs
- 12% carry 100-199 SKUs
- 12% carry 200 or more SKUs
Promotions
In what ways are retailers advertising/promoting the business? Participation and promotion on social media took the number one slot among advertising and promotion techniques, with 76% of respondents participating. Real-world, analog techniques of promoting--in-store materials such as lectures, handouts, product sampling, and store newsletters--are popular in two out of three stores (65%). About two in three stores have a website (63%), and perhaps more notable, more than one in three (37%) don't. More stores use online advertising (37%) than radio (29%) or TV (15%). Nearly one in four stores (23%), perhaps wisely, takes advantage of the relatively less-noisy advertising medium of direct mail compared to the online chaos. Another 17.6% also use other outreach methods such as e-newsletter, ads in local publications and newspapers, raffles, and billboards. TapMango got a mention, and good old word of mouth is still a go-to. Only 3% do not make any effort to advertise or promote their business.How much is being invested? Take a look:

The Bottom Line: Net Profits
Percentages can be deceiving. Although net profits look fattest for Group 6, our high supplement stores, at 11.15%, which translates to $46,500 annually. And while percentage net profits in Group 1 are less than half that of Group 6, at 4.88% vs. 11.15%, this represents $346,320 annually.