Demand for natural products is as strong as ever, according to data collected in the 36th Annual WholeFoods Retailer Survey. Independent stores that participated in this year’s survey had a strong showing in 2013, selling a combined $741 million throughout their more than 1.24 million ft2 of total retail space. Most stores reported gains this year, and businesses are optimistic about the outlook for 2014, all excellent news for those who value the expertise and unique flavor that independent stores contribute to the natural and organic supplements, grocery, HABA and home products industries.
Before sharing more numbers, we want to say a sincere thank you to all the stores that took the time to fill out our 2013 questionnaire. Without your participation, this analysis wouldn’t be possible. Also, congratulations to Nutrition Centers of Danville, KY, which was randomly selected from this year’s survey participants to win $100 in cash. Last, thank you to Jay Jacobowitz, president and founder of Retail Insights, and WholeFoods merchandising editor, who was integral to this year’s data compilation and analysis.
About this Survey
Independent retailers from all across the country participated in the 2013 WholeFoods Retailer Survey, which covered July 1, 2012 through June 30, 2013. Stores represented all U.S. regions, with the largest number of participants being from the West (35%) and the East (20%). The remaining businesses were located in the Midwest (18%), South (17%) and the Rocky Mountains (9%). All market types—from large towns to major metropolitan cities—were very evenly represented.
 Another characteristic to consider was store age. Like last year’s survey, we had many veteran store participants with decades of retailing experience under their belts. In 2013, stores had been in business for an average of 23 years, 19 of which were under the present owner. Of note, there were also several stores participating in the 2013 survey that had changed ownership within the past five years or so. As Generations X and Y continue to become business leaders, WholeFoods anticipates this trend will carry on and become a factor in store sales and profits in the future.
This year, every survey participant relied on physical locations for their main business, though several stores earned a small amount of revenue from e-commerce sales. Overall, many stores were mainly focused on perishables sales, but there is a strong core of shops for which natural and organic supplements are their bread and butter.
Within this broader picture, we again broke down our analysis by store type, namely by how much perishable food a store sold. It is the view of WholeFoods Magazine that perishable foods are the single-most influential factor in a store’s foot traffic, size and gross sales. Included in our definition of perishable items are refrigerated foods, frozen foods, fresh produce and prepared foods (like deli offerings, fresh juice bars, bakery items, ready-made meals and the like). These items draw shoppers to a given venue on a regular basis, often weekly or even daily.
To get an apples-to-apples comparison of how your store compares with our survey pool, estimate the percentage of your gross sales that come from your perishable food departments. Then, see how it fits into the five perishables ranges that we used to organize the survey’s tables and charts, from 0–9% perishables to 55+% perishables. Fitting your store into the closest perishables range will give you the most accurate look at performance across all categories, from cost of goods and gross profits, to labor and rent costs, to your bottom line.
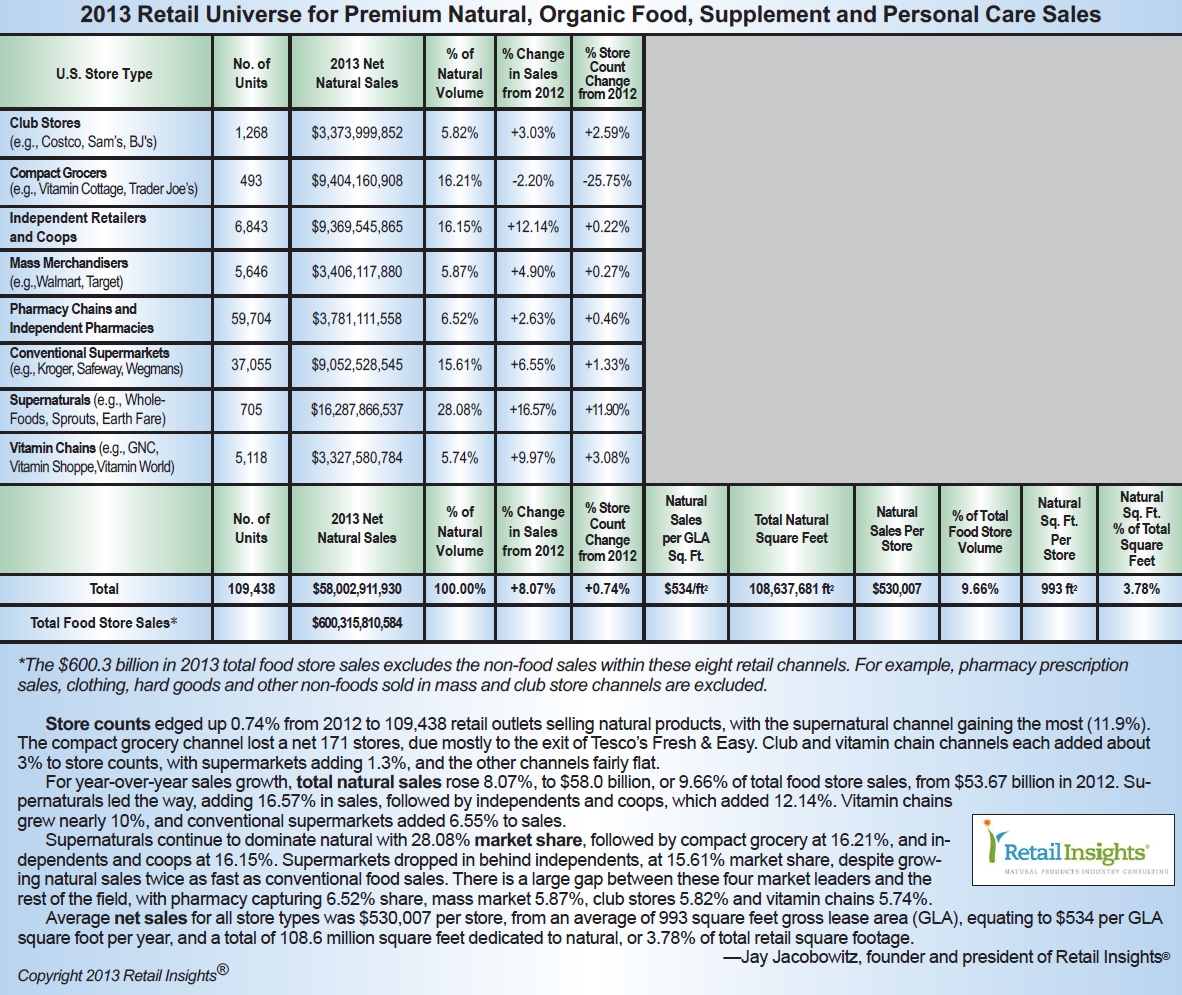
Before proceeding, it’s important to note 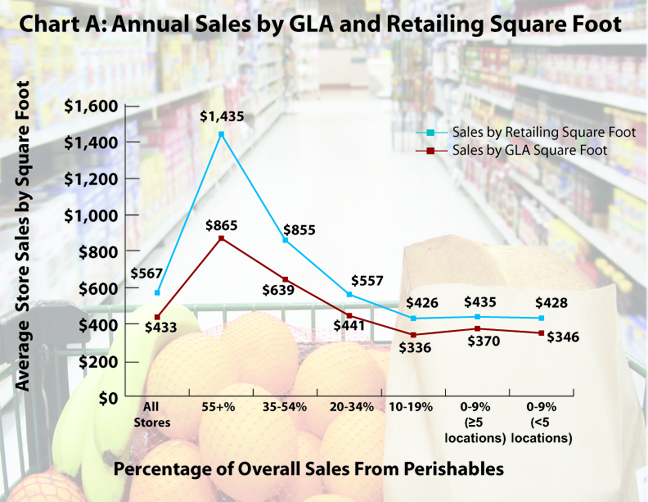 that only non-public independent stores were invited to participate in the WholeFoods survey. Thus, our analysis doesn’t include some of the most influential businesses in the natural products industry like Whole Foods Market, Sprouts Farmers Markets or Vitamin Shoppe. We also excluded pharmacy chains, conventional supermarkets, club stores and mass merchandisers so as to give you a true snapshot of the state of independent retailing. Nonetheless, you can see sales data about these large players alongside the WholeFoods numbers in the 2013 Retail Universe table on page 25, which includes data from the Retail Insights database.
Sizing it Up
A lesson learned from this year’s survey data: success comes in all sizes. 2013 stores’ average gross lease area (GLA) was 4,511 ft2, with an average selling space of 3,421 ft2. These figures varied by store type; the larger the GLA and retailing area, the more revenue from perishables departments.
Overall, 2013 participating stores’ footprint was slightly smaller on average than we saw in last year’s survey (5,300 ft2 GLA and 3,960 ft2 retailing area in 2012). Despite averaging a smaller footprint, this year’s independent businesses are making a big impact across the broader natural products landscape. The 2013 stores had a combined footprint of 1.24 million GLA ft2 and nearly $741 million in sales; both figures are higher than what we saw in 2012, when we tracked about one million GLA ft2 and $665 million in sales.
Other data captured included the size of a store’s backroom in relation to its GLA. Last year, we made the point that the percentage of GLA a store used for selling space is often correlated with store type. Heavy perishables-oriented stores (those earning 55+% of all sales from perishable foods) generally need bigger backrooms to organize products, store inventory and conduct administrative tasks than a supplements-focused store requires, and thus large grocers tend to use more of their GLA for non-retail support functions.
This year, there was a wide gap between stores with the most and least perishables sales. The average backroom for all stores was 24% of GLA and, as expected, the 55+% perishables group had the largest stock rooms (39% of GLA, or 5,320 ft2 on average) while the larger supplement stores (0–9% perishables with five or more locations) had the smallest back areas (11% of GLA, or 259 ft2 on average).
Backroom size varied more or less with the amount of perishables; larger back rooms for high-perishables stores, smaller for supplement-focused stores. Supplement stores with less than five locations had the second smallest back rooms (17% of GLA); meanwhile the 20–34% group had nearly the same back room size (18% of GLA) on a percentage basis.
 Sales Tales
Now, let’s look at sales data through the lens of store size. This year, annual sales per GLA square foot was $433/ft2, and annual sales per retail area square foot was $567/ft2.
Stores with the most perishables sales had more than double these numbers, at $865/GLA ft2 and $1,435/retail area ft2. Also earning higher-than-average sales per square foot was the 35–54% perishables group, which came in at $639/GLA ft2 and $855/retail area ft2.
At the other end of the spectrum were the supplements-focused stores, which generate 0–9%of their sales from perishables. Such supplements stores with five or more locations earned $370/GLA ft2 and $435/retail area ft2, and supplement stores with fewer than five locations earned $346/GLA ft2 and $428/retail area ft2.
Interestingly, these stores did not have the lowest sales per GLA square foot. Rather, shops in the 10–19% perishables group generated only $336/GLA ft2 and $426/retail area ft2. As we saw last year, this “middle” level of perishables—more than smaller stores, but less than the largest stores—can be less efficient in several operating areas, from the use of space to inventory turns, for example.
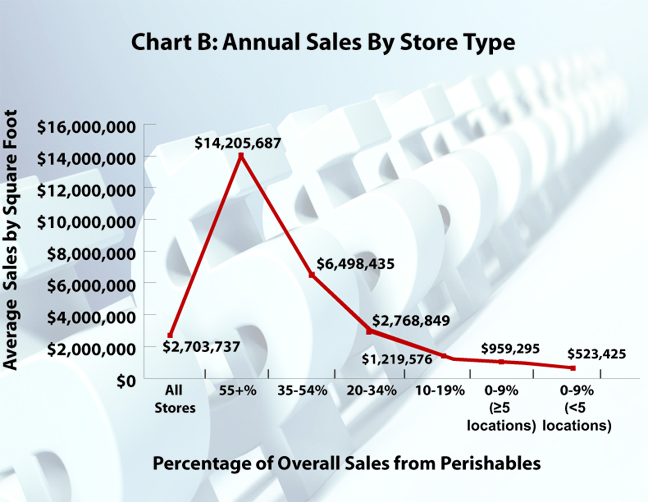
Panning out a bit, annual overall sales for all stores averaged $2.70 million, which is less than that reported by stores in 2012 ($3.61 million), when participating stores were larger on average. Annual sales data, once again, were correlated with store type. The biggest sales were reported by stores with the most perishables earnings, at an average of $14.206 million annually. The next highest sales ($6.50 million) were earned by the 35–54% group. This sales trend continued down to the 0–9% perishables group with fewer than five locations. They grossed a solid $523,425 this year.
Taking it to the Bank
These sales numbers are an important bellwether for the health of the industry. But the success of a retailer, as you well know, also hinges on how these numbers stack up against expenditures and what is banked at the end of the day as profit.
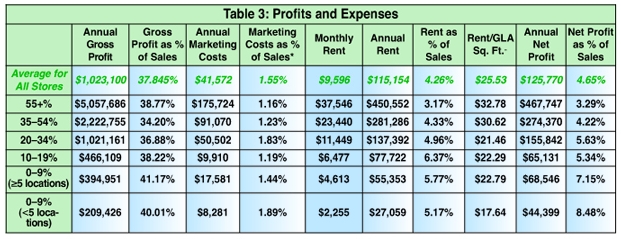
This year, stores’ average gross profit margin (GPM), the top line profit after cost of goods, but before all expenses such as rent and payroll, was 37.85% for an average of $1.02 million. All store types came in relatively close to this percentage, though the 35–54% perishables group had the lowest percentage GPM at 34.20%. Coming out on top for GPM were the supplements-focused stores (0–9% perishables). Businesses with five or more locations had the highest GPM (41.17%) this year and last year, followed in 2013 by businesses with less than five stores (40.01%).
This is a change from 2012 figures, when the second-highest GPM belonged to the 55+% perishables group. Also, the 10–19% perishables category moved from 36.49% to 38.22% this year.
As in 2012, stores focusing on natural and organic supplements reported the highest net profit (which is free cash flow after all expenses, but before taxes) as a percentage of sales. Those with five or more locations had net profits of 7.15%, while supplements-focused businesses with fewer than five stores had the highest net profits of all at 8.48%. The average net profit percentage for all stores was 4.65%, which is just slightly under the 2012 average of 4.82%.
On a dollar basis, though, the more perishables sales, the higher the gross and net profit. The average gross profit for all stores was $1,023,100, and net profit was $125,770. There was great variation of both figures by store type. Large grocery stores (55%+ perishables) earned the most profit ($5,507,686 gross and $467,747 net), while supplements stores with the fewest locations took home the least ($209,426 gross and $44,399 net).
Stores with the largest swing in net profits between 2012 and 2013 were supplement chains with five or more stores. This group went from $103,599 last year to $68,546 this year. This is primarily because of the larger pool of respondents to this year’s survey, which pulled average net profits down for supplements chains with five or more stores.
Again, 10–19% perishables stores are 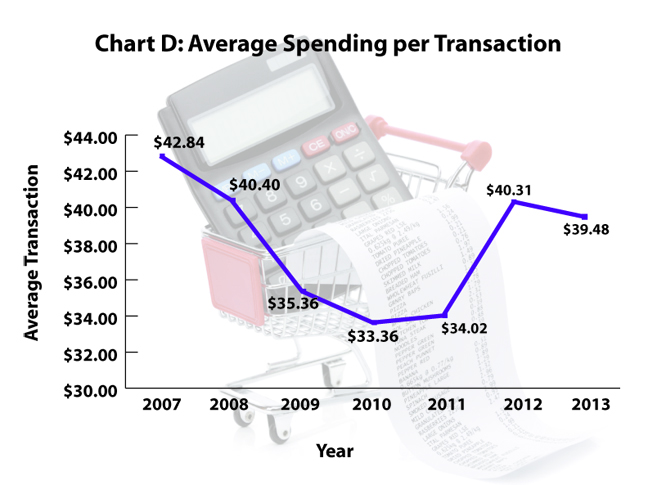 gaining some traction in terms of profit. Last year, this group’s net profit dipped more than a percentage point under the 20–34% group. While the 10–19% perishables stores still don’t have as high a net profit percentage as the next bracket of perishables stores this year, the difference is only over a quarter of a percent (5.63% for the 20–34% stores and 5.34% for the 10–19% group).
This might be due to a bump in their average transaction amount. In fact, the 10–19% perishables group was only one of two store types that beat out their average sale from last year. The 10–19% stores went from $28.47 in 2012 to $30.33 this year; and the 0–9% perishables (<5 locations) stores went from $28.50 to $31.79. The latter is a standout growth of about 11.5%, which may be partly attributable to the differing pool of respondents from year to year.
The average transaction for all stores was $39.48, slightly less than last year’s figure of $40.31. This is a clear indication that the slump from the recent recession is not having big reverberations in the natural channel. Shoppers are spending about as much as they did last year, which is close to what we saw in 2008. Chart D illustrates this trend.
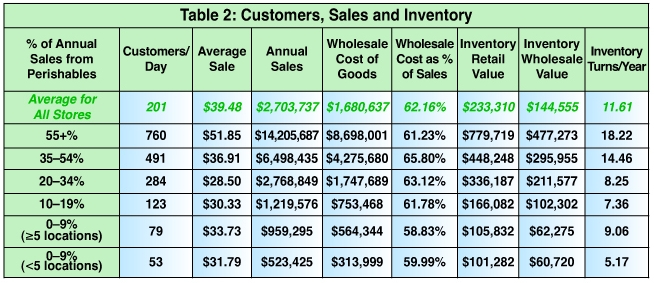
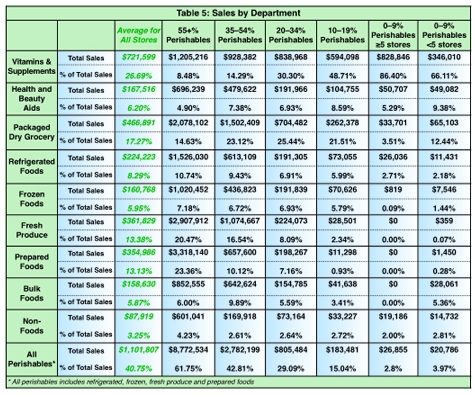
Meanwhile, foot traffic was strong this year, at 201 customers per day overall. But heavy perishables stores (55+% perishables) had significantly more shoppers on a daily basis than this average with 760 transactions per day. This makes sense because their most popular sections are prepared foods (earning 23.36% of their sales) and fresh produce (generating 20.47% of their sales), two of the most important departments as shoppers are deciding where to shop. In the next section, we’ll break down how the various store groupings performed across all product categories.
There is a direct, linear relationship between perishables percentage of sales and transaction counts, from 760 shoppers daily in the largest perishables stores to 53 customers in the smallest stores focusing on natural and organic supplements.
The next–highest foot traffic averages were also perishables-heavy stores, with the 35–54% perishables group serving 491 people daily and the 20–34% perishables group handling 284 customers daily. These shops also had strong prepared foods and produce sales. The supplements-focused stores with five or more locations rang up 79 people per day, while the stores with fewer than five locations had 53 customers daily.
Aisle by Aisle
Overall, stores in the survey earned an average of $1.10 million from all perishable food categories this year, or 40.75% of total revenue. It’s important to note how these perishables sales were derived by department to understand what’s working for the various store types.
First up are prepared foods and fresh produce, which were big-ticket departments for the two top-earning, highest-traffic store types: 55+% perishables and 35–54% perishables. The 55+% group brought in about 23.36% ($3.32 million) of its revenue from prepared foods and 20.47% ($2.91 million) from fresh produce. The 35–54% group earned 10.12% ($657,600) of its sales from prepared foods and 16.54% ($1.07 million) from fresh produce. The breadth and depth of these two departments in the two largest-perishables store types commanded a far higher percentage of sales, and far more gross sales dollars, than stores offering less prepared foods or fresh produce. Clearly, these high-perishables retailers are attracting daily and multiple-times-per-week shoppers looking for fresh meal solutions.
By contrast, supplements-focused stores and the 10–19% perishables group sold practically no prepared foods at all (less than 1%) and nearly as little fresh produce (almost none from supplements stores and 2.34% from the 10–19% group).
Meanwhile, the 20–34% group had modest sales of fresh produce (8.09%, $224,073) and prepared foods (7.16%, $198,267).
Of interest, the food area where the 20–34% perishables stores earned their bread and butter was outside the perishables category. It was packaged dry goods (25.44%, $704,482). This percentage of sales was higher than any other store grouping, though the 35–54% stores and the 10–19% stores sold nearly as much (23.12%, $1.50 million and 21.51%, $262,378, respectively). It was interesting to note our groupings of stores at opposite ends of the spectrum sold close to the same proportion of packaged dry goods, though the dollars diverged. The 55+% perishables stores earned 14.63% ($2.08 million) of its sales from packaged dry goods, while the 0–9% stores with less than five locations made 12.44% ($65,103) of their sales from this category. Supplements-focused larger chains sold the least packaged dry goods of all, with these products accounting for just 3.51% ($33,701) of their overall sales. The average for all stores was 17.27%, which came out to $466,891.
Back in perishables, the  remaining two areas—refrigerated and frozen foods—had a fairly even showing of sales across all store types from the perspective of percentages. But, of course, the dollars tell a different story. For all stores, the refrigerated category averaged 8.29% of sales ($224,223), with a high from the 55+% group (10.74%, $1,526,030) and a low from the smallest supplements stores (2.18%, $11,431).
Meanwhile, frozen foods drove in an average of 5.95% of all sales ($160,768) for all stores. The top frozen food sellers were perishables stores, and their sales were very close in terms of percentages (from 5.79% for the 10–19% stores to 7.18% for the 55+% stores). The larger supplement chains earned practically no sales from the category, while stores with fewer than five locations earned 1.44% or $7,546.
The final grocery category we tracked in this survey, bulk foods, earned an average of 5.87% ($158,630) for all stores. That was about as much as the frozen food sales. The stores with the most bulk food earnings on a percentage basis were the 35–54% perishables group, which brought in 9.89% ($642,624) of all its sales from these foods. Unlike most other store types, these shops earned more from bulk foods than from either frozen or refrigerated foods.
Also of interest, the smallest supplements stores earned nearly the same percentage from bulk foods as the grocery-focused stores. The 0–9% perishables group with less than five stores had 5.36% ($28,061) of sales from bulk; the 55+% stores had 6.00% ($852,555); and the 20–34% perishables stores had 5.59% ($154,785).
Now, let’s talk about natural and organic supplements sales. By organizing our analysis by percentage of perishables sales, we can zero-in on several successful, but quite dissimilar business models, in this case, those that focus on the vitamin/supplements category. It is no surprise that the 0–9% groups brought in the vast majority of sales from this market segment. Those with fewer than five locations had 66.11% ($346,010) of their sales from natural and organic supplements; supplement chains with five or more locations had 86.40% of their sales from supplements, which equated to an above-average dollar amount of $828,846.
As perishables sales entered the picture, supplement sales declined linearly, with the 55+% perishables group generating the smallest percentage of sales from supplements (8.48%), far below the average for all stores of 26.69% ($721,599). Nonetheless, the dollars comparison tells us that the most perishables-heavy stores generate the lion’s share of dollars in the category: $1.21 million for 55+% perishables group versus $346,000 for the 0–9% perishables with fewer than five locations. This is about four times the absolute dollar size of the smallest supplements stores that generate 66.1% of sales from supplements.
Consider the overall average, 26.69%, carefully. Natural products stores have very diverse business models, with many being supplements-heavy or perishables-heavy. Thus, the 26.69% figure may not actually be the norm for many stores.
As for health and beauty aids, the average for all stores was 6.20% of sales, which equates to $167,516. The highest earners on a percentage basis were the smallest supplements stores. They generated 9.38% ($49,082) of their sales from the category.
Last, non-foods, like pet care and household items, earned all store types about 2–4% of overall sales, with an average of 3.25% ($87,919).
Private Eye
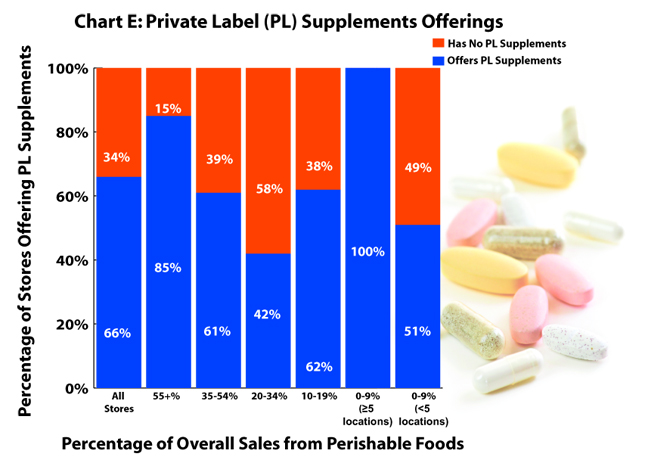
If you were to walk into a U.S. independent natural products store, there’s nearly a 66% chance that you’d be able to purchase a store brand supplement. Just 34.21% of this year’s survey pool said that they don’t sell any store brand products at all. Every large supplement chain in this year’s survey had private label supplements, and the vast majority (90.20%) of them had more than 200 supplement SKUs in their inventory.
Most (85%) of the 55+% perishables group also sold private label supplements, though fewer SKUs than the larger supplement chains. Most offered 25–50 private label supplement SKUs.
At the low end, only the 20–34% perishables group had fewer than half (42%) of the stores selling private label supplements. None of these businesses had more than 100 SKUs in their inventory.
Some 23% of all stores had non-vitamin private label SKUs, too.
Large Expenditures
Inventory. Over the course of a year, stores spent about $1.68 million on inventory, which was about 62.16% of their overall sales. This amount varied widely by store type with the annual wholesale cost of goods being $8.698 million for the 55+% perishables stores, or 61.23% of their overall sales. The other perishables groups had a higher percentage of sales going to inventory, suggesting stores with lower total sales volume command less favorable wholesale purchase agreements, leading to higher cost-of-goods as a percentage of sales.
The average inventory turns for all stores was 11.61, and this figure was correlated with perishables sales percentage with 55+% perishables stores at 18.22 turns per year, to 14.45 turns for the 35–54% group, to 8.25 turns for the 20–34% group, to 7.36 turns for the 10–19% group.
For this last group, this works out to an inventory turn once every 50 days, not the throughput you’d expect from a store focused on fresh foods. The 20–34% group is not much better at 44 days. This is another example of the relative inefficiency of the “middle” perishables type stores (which are the 10–19% and the 20–34% groups), since their inventory turns are lower than even supplements-oriented retailers with five or more stores (9.06 turns per year).
It might well be easier to be efficient if you have multiple stores and a narrow product focus, as with supplements-oriented stores. In stores with a broad focus, inventory can easily get out of hand. “Middle” perishables stores in this year’s survey clearly don’t have the critical mass in perishables to drive large numbers of daily customers that gobble up their fresh offerings. They must settle for attracting more occasional customer visits, since they don’t register on shoppers’ radars as “the” place to shop for dinner or fresh meal solutions compared to other choices in the marketplace.
Last, the fewer-than-five-store supplements retailers appear to be leaning on vast selections of SKUs as a come-to-market strategy, since their inventory turns are lowest of all, at 5.17 turns per year.
 Marketing. Stores also put an average of $41,572 per year into marketing themselves, which was just 1.55% of their annual sales. While a small percentage, it is nearly twice the level we saw in the 2012 study. This may be because the pool of respondents this year are newer owners, who wish to refresh their store’s brand message out in their communities, and are therefore spending more on marketing.
This year, the smallest supplements stores put the highest percentage of sales into marketing their business, which was 1.89% annually or $8,281.
Rent. Annual spending on rent averaged $115,154, which was about 4.26% of overall sales. As expected, the largest perishables stores spent the most on rent each year ($450,552 or 3.17%), but the group that spent the most on rent as a percentage of sales was the 10–19% perishables stores, which spent 6.37% of their sales ($77,722 annually). This is further evidence proving the relative inefficiency of the “middle” perishables model.
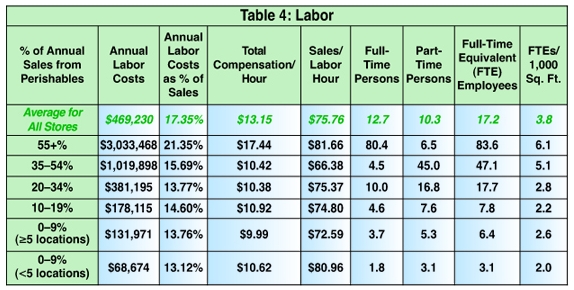
Labor. WholeFoods also tracked labor costs. Stores spent an average of $469,230 on labor last year, which is 17.35% of their overall sales. It was interesting to note that the 0–9%perishables stores up to the 20–34% perishables stores had roughly the same full-time equivalent (FTE) employees/1,000 ft2 GLA; it ranged from 2.0 FTE/1,000 ft2 GLA for the smallest stores to 2.8 FTE/1,000 ft2 GLA for the 20–34% perishables stores.
The “middle” perishables group of stores (10–19% and 20–34%) do not have the critical mass in perishables that requires the heavier staffing of higher-perishables stores. Perhaps, we can conclude that their customer service levels are also lower, since they have the fresh departments such as prepared foods and produce, but those departments do relatively lower volume, and cannot afford full-time staffers to run them.
The range of sales per labor hour among all groups was very narrow, from a low of $66.38 for the 35–54% group to a high of $81.66 in the 55+% perishables group.
The smallest supplement stores with less than five locations clearly are getting the most out of their workforce. They had the second-highest sales per labor hour at $80.96, well above the average of $75.76 for all stores. Only the 55+% perishables group had more sales per labor hour with $81.66. The 55+% stores also had the most compensation per hour at $17.44. This was far above the average of $13.15.
The least productive group for sales per labor hour was the 35–54% perishables group. One reason may be that, although they are offering critical mass selection of perishables, the presentation is crammed into a relatively small space, average 9,186 ft2 GLA, compared to the 55+% group, which averages a 50% bigger footprint of 13,746 ft2 GLA. Perhaps, in the minds of consumers, the larger footprint more readily registers on their radar screens as a viable food-shopping alternative, while a store less than 10,000 ft2 GLA does not.
On the Horizon
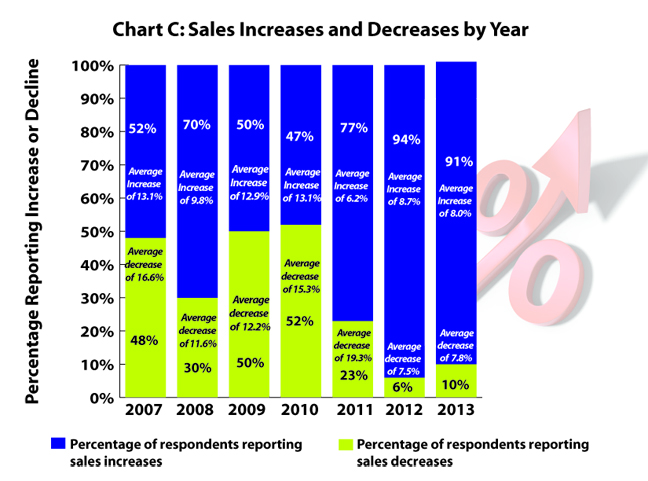
To sum up, stores were very positive about their 2013 sales, and had an optimistic outlook for what is to come in 2014. Continuing on last year’s trend, most retailers—about nine in 10—said their sales numbers increased this year, compared with 2012. It is great news that the split of “ups” versus “downs” continues to move in this direction. Just a couple short years ago, these proportions, unfortunately, were reversed. So, it is encouraging to see two straight years in which stores with increased year-to-year sales far outnumbered those with decreased sales. 95% of participants said they are expecting to see their revenue increase next year by nearly the same amount as it did this year (6.8%).
Clearly, the independent natural products retailing industry is in good hands as most stores are growing monetarily and a good number are also expanding physically. This year, about 25% of stores completed some level of remodeling, and 29% hope to add some square footage next year. This speaks to the confidence that stores have that their customer base is active, strong and thriving. They value natural and organic supplements, food, HABA and home products, and aren’t planning to cut back their buying any time soon. WF
For additional sales data, please click here.

Published in WholeFoods Magazine, December 2013


