Sweets, Snacks, and the New Better-for-You Mood
July 3, 2026

Last week, I was having a conversation with the owner of a health food store in the Mobile, AL, area regarding Google Analytics. He wanted to know what he should be paying attention to amongst all of the various reports available. I understand that with 50+ reports it can get a bit confusing. So, in this post, I will explain Google Analytics a little, and cover the data points you should check regularly.
If you are not familiar with Google Analytics, it is the standard when it comes to tracking Web site traffic. Even if your hosting provider has some mechanism by which they show you stats for your site, it will not show you the stats that Google Analytics does. There is no question that you should absolutely have Google Analytics installed on your site. If you don't have Google Analytics installed, then it becomes almost impossible to understand how people are using your Web site. A short list of things Google Analytics can show you:
Ready? Let's get started...
Yea, but how much is it going to cost me?
If you are not familiar with Google Analytics, then let's start with price. It's FREE. Yup, that's right. This wonderful little tool is just given away for free by Google. If you have a Google Account, just go to the Google Analytics home page to sign up. Google even provides you with amazing instructions for how to get started.
Now that you have Google Analytics installed, let's take a look at the more important reports that are available. Keep in mind that it will take a day or two to show any data that is worthwhile.
Audience Overview
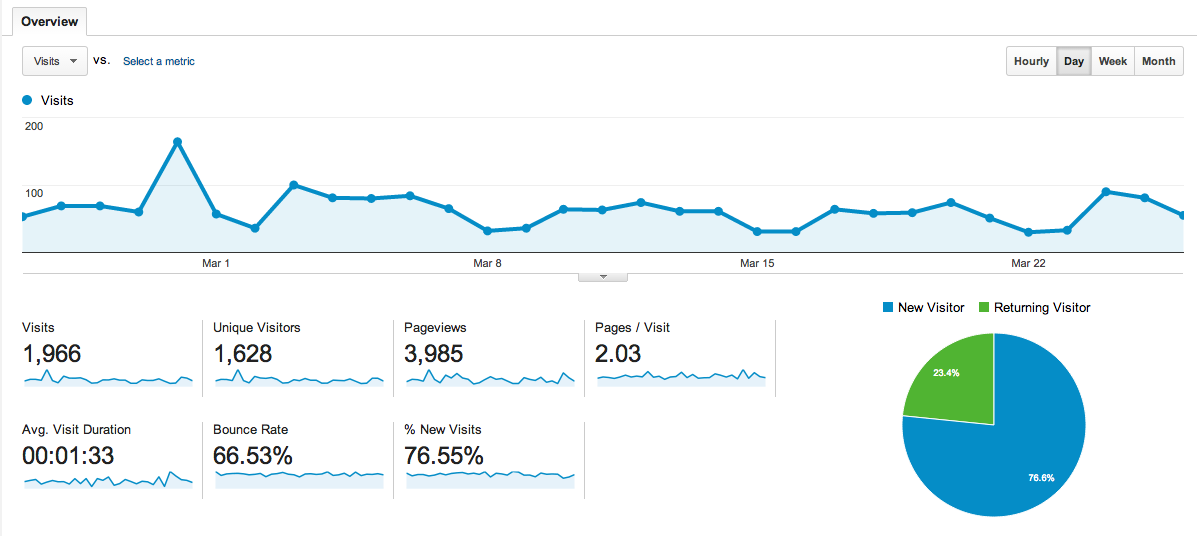
When you first log into Google Analytics, it shows you a graph of the Visits over the last 30 days. Typically, I start by looking for spikes in traffic. Any spikes will indicate that a piece of content we wrote or a product was extremely popular. It can also indicate that that the site got posted somewhere that is sending us a lot of traffic. Either way I want to know who, when, how the spike was created. If you hover over the points on the graph it will tell you the numerical value of the point.
This Audience Overview also shows data points for Visits, Unique Visitors, Pageviews, Pages per Visit and Average Visit Duration. All of these are important to know. Depending on the type of site you have (commerce vs blog vs brochure site) I would weight them differently. Visits and Unique Visitors are just barometers for how much traffic you are getting. Generally speaking the more the better. But, I also want to caution you that a large amount of traffic without conversion means you are missing something (namely sales). I'll gladly take a lower numerical value of visitors for a higher percentage of conversions.
Pageviews and Pages Per Visit tell me that once the person is on the site they are poking around a bit. The Duration of their visit tells me whether it was just a cursory glance of the site or if they are reading through something on the site. Several months ago, I wrote a blog poston our site comparing various Content Management Systems. It is the longest I've ever written and the Duration for that page on our site averages around 9 minutes. That tells me that, even though the content is really detailed and long, that people are reading it. Those are the types of metrics that you want to pay attention to and adjust depending on the results you are seeing.
How are people accessing my site?
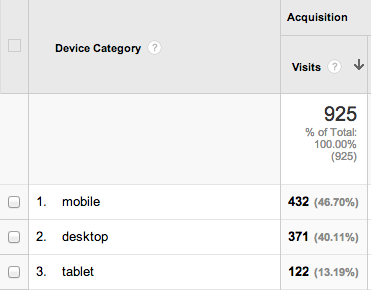
If you look at the side navigation in Google Analytics you should see Mobile and then below it find Overview. I like this report as it gives me information about the types of devices that are using the site. I can immediately tell whether I have a mostly mobile or desktop audience. As you can see in the image below the audience for this particular site is mostly mobile. It is a site that does a lot of promotion of articles and content on Facebook. If I have an audience that is mostly mobile and my website is not responsively coded or I only have a mobile version then I am handicapping my site and possibly losing sales.
Where is my traffic coming from?
Next, we are going to look at Acquisition / All Traffic report. In the side navigation go to Acquisition and then All Traffic. I like this report as it will tell you where your traffic is coming from. Remember those spikes I mentioned? Those should manifest themselves here as a site that has sent you a large amount of traffic. If you want to know the specific URL that is sending the traffic then go to Acquisition and then All Referrals and click on the website sending you the traffic. It should give you a breakdown of the URLs that are originating the traffic. This can be extremely useful if you are running ads online. If you don't want to create unique URLs for the ads then this should give you a general sense of how much traffic those ads are sending.
What are they looking at on my site?
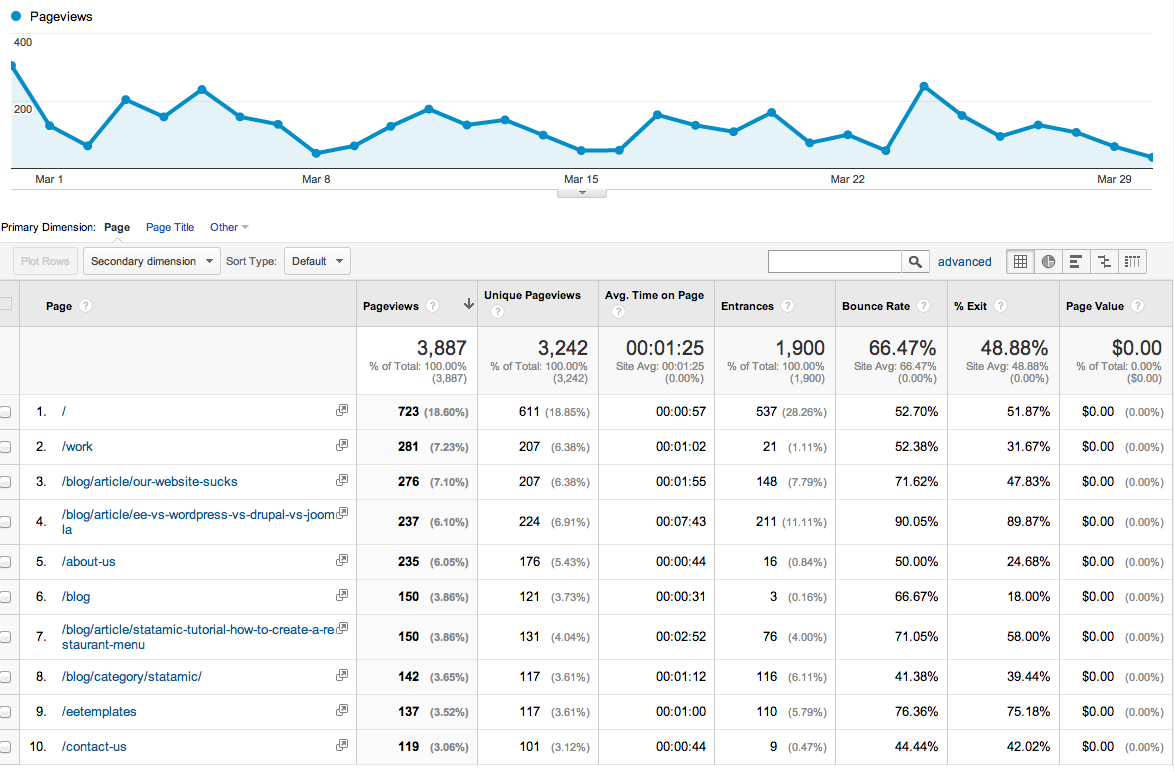
The last thing (and quite possibly the most important) that I look for is under Behavior / Site Content / All Content. This report tells you what people are looking at on your site. It is important to note that a forward slash (/) means the home page. More than likely the homepage will always be at the top of the list. I like to check this report weekly. Especially if a client is blogging or updating products a lot. It tells me what is hitting the mark with the audience. If a certain topic or product is getting more interest than others then you will want to spend more time writing content of the same type and topic.
I hope that you find this post helpful. As always, we are here to help if you need it. I'd like to offer you a free (short) analysis of your Google Analytics traffic. Just send me an email to get started.

Marcus Neto is the Founder of Blue Fish, a branding & digital services studio based on the Gulf Coast that specializes in ExpressionEngine development. In addition to writing (a lot) on the Blue Fish blog he also likes taking pictures, twittering, and spending time at the beach.
Posted on WholeFoods Magazine Online, 3/24/15