Once again this year, WholeFoods partnered with Readex Research to gather results for the 12 months ending in June 2018. The response this year was significant—it’s our largest survey ever, reflecting data from U.S. independent natural products retailers operating over 700 stores, totaling nearly $1.8 billion in sales from 4 million square feet.
Average sales per store from our reporting period were $2,439,257. Since Amazon closed its deal to buy Whole Foods Markets in August 2017, this year’s results reflect 10 months of competition from the new Amazon-Whole Foods. While some retailers did report sales declines, many more reported increases, and the vast majority said sales remained stable. Overall, respondents reported a sales increase of 1.6% compared to the sales they had the prior year.

Average increase in sales over prior year: 1.6%
No doubt about it, money was being made by many. And while the nearly $1.8 billion sold by independents in our survey is certainly a hefty number, it represents just 16% of the $11.44 billion sold by all U.S. independent natural retailers in 2018. And that $11.44 billion was just a fraction—13.76%—of the $83.2 billion in total natural organic sales through all eight retail and food-store channels in 2018. For a complete update of the U.S. natural organic retail market, see the Retail Insights® 2019 Retail Universe for Premium Natural, Organic Food, Supplement & Personal Care Sales (see page 36). The Retail Universe covers all eight retail channels including supernaturals such as Amazon Whole Foods Market and Sprouts Farmers Market; conventional supermarkets; mass merchandisers, pharmacies and vitamin chain stores.
Over the rest of the article, you’ll find an overview of the highlights from this survey, so you can see how your store stacks up. And mark your calendar for our webinar on Wednesday, April 24, at 2:00 p.m. EST. Jay Jacobowitz will discuss key findings from the survey that will help inform your business decisions and set you up for greater success. You can also access the webinar on demand in our retail content library in late April.
Who participated in this survey? Retailers just like you. As in years past, the independent retailers who responded to our survey have operated their stores for decades. On average, they’ve been in business for 31 years, with an average of 24 years under the current ownership.
This year’s survey respondents came from every section of the country, making this survey a reliable representation of independent natural products retailers. Stores from the Mid-Atlantic represented 21% of respondents; the Midwest also came in with 21%. Stores from the Southeast represented 18% of respondents, and there were 14% from the Southwest, 9% from the South, 6% from New England and 5% each from the Mountain Region and the Northwest.
This year we heard from retailers from every sort of trade or market area, from rural towns to urban centers to major metro areas. Towns with a population of less than 50,000 represent the largest chunk of our respondents, at 39%. Small cities (50,000 - 99,999 population) chipped in with 24%; medium cities or suburbs (100,000 - 299,999 population) added 14%; large cities or suburbs (300,000 - 999,999 population) made up 10% of respondents; and major metro areas that are home to more than 1 million accounted for 13% of respondents.
How to Use This Survey If you are an independent natural products retailer, you’ll get the most out of this survey by first tallying up your sales from the four main fresh-foods departments: refrigerated, frozen, produce and deli.
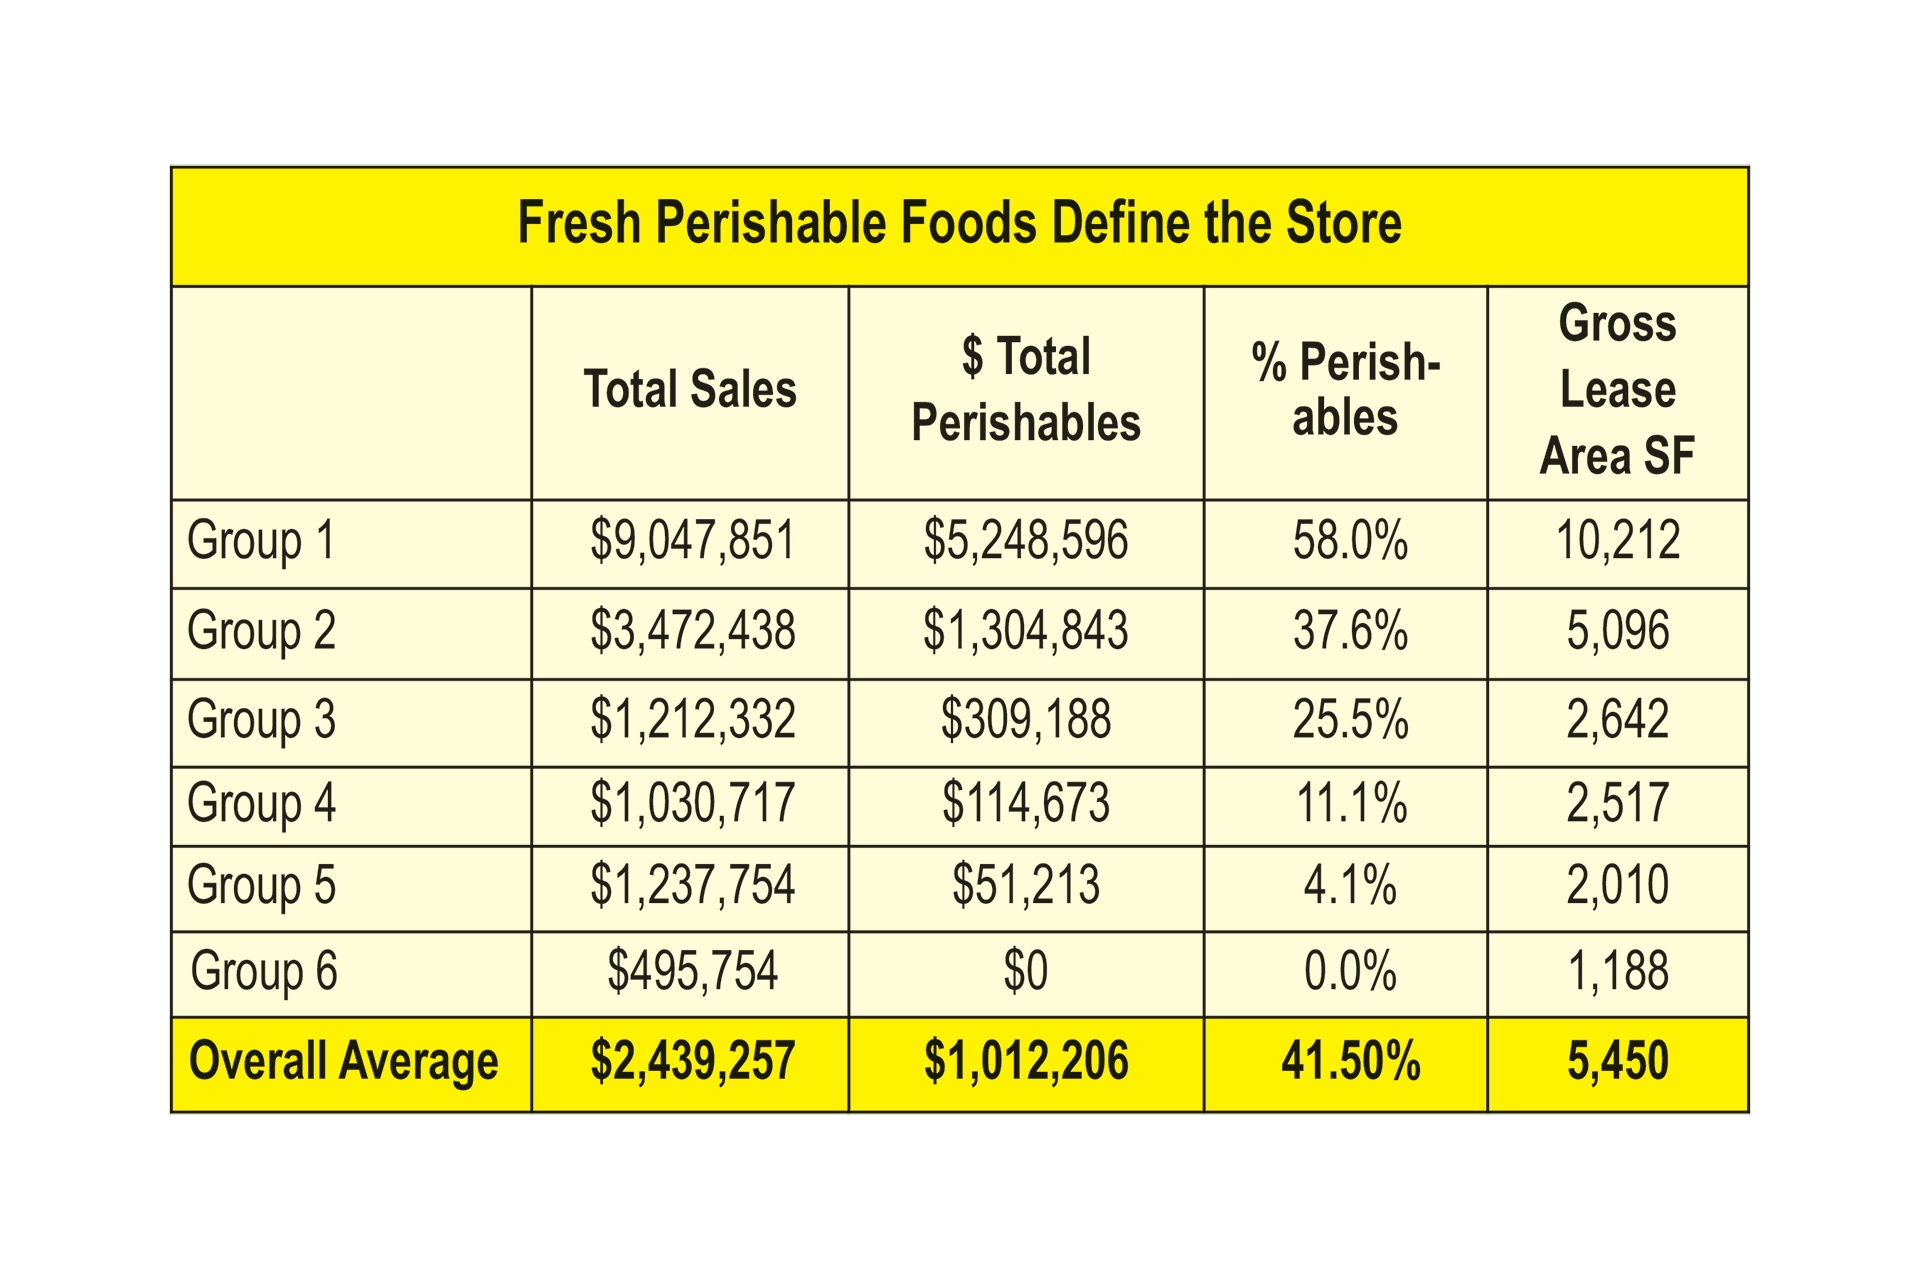
Once you find what percentage of your total sales these four categories represent, you can compare your results to similar stores in your corresponding Group—either Group 1, 2, 3, 4, 5 or, new this year, Group 6. We organize the survey this way because perishables largely determine how large a store will be, and the sales it achieves. The reason we added a sixth group: Many stores told us they sell no perishables—so many stores, in fact, that a new group was needed to accurately report their results. (A small caveat to Group 6: They probably do have one or two doors of cooler, just for probiotics and the few other supplements requiring refrigeration.) All the other five groups do sell perishables, ranging from just 1% up to 100% of sales. A store in Group 6 looks nothing like a store in Group 1, which is essentially like a Whole Foods Market. Compare your results to the results of stores only in your perishables group. (See Figure 2.)
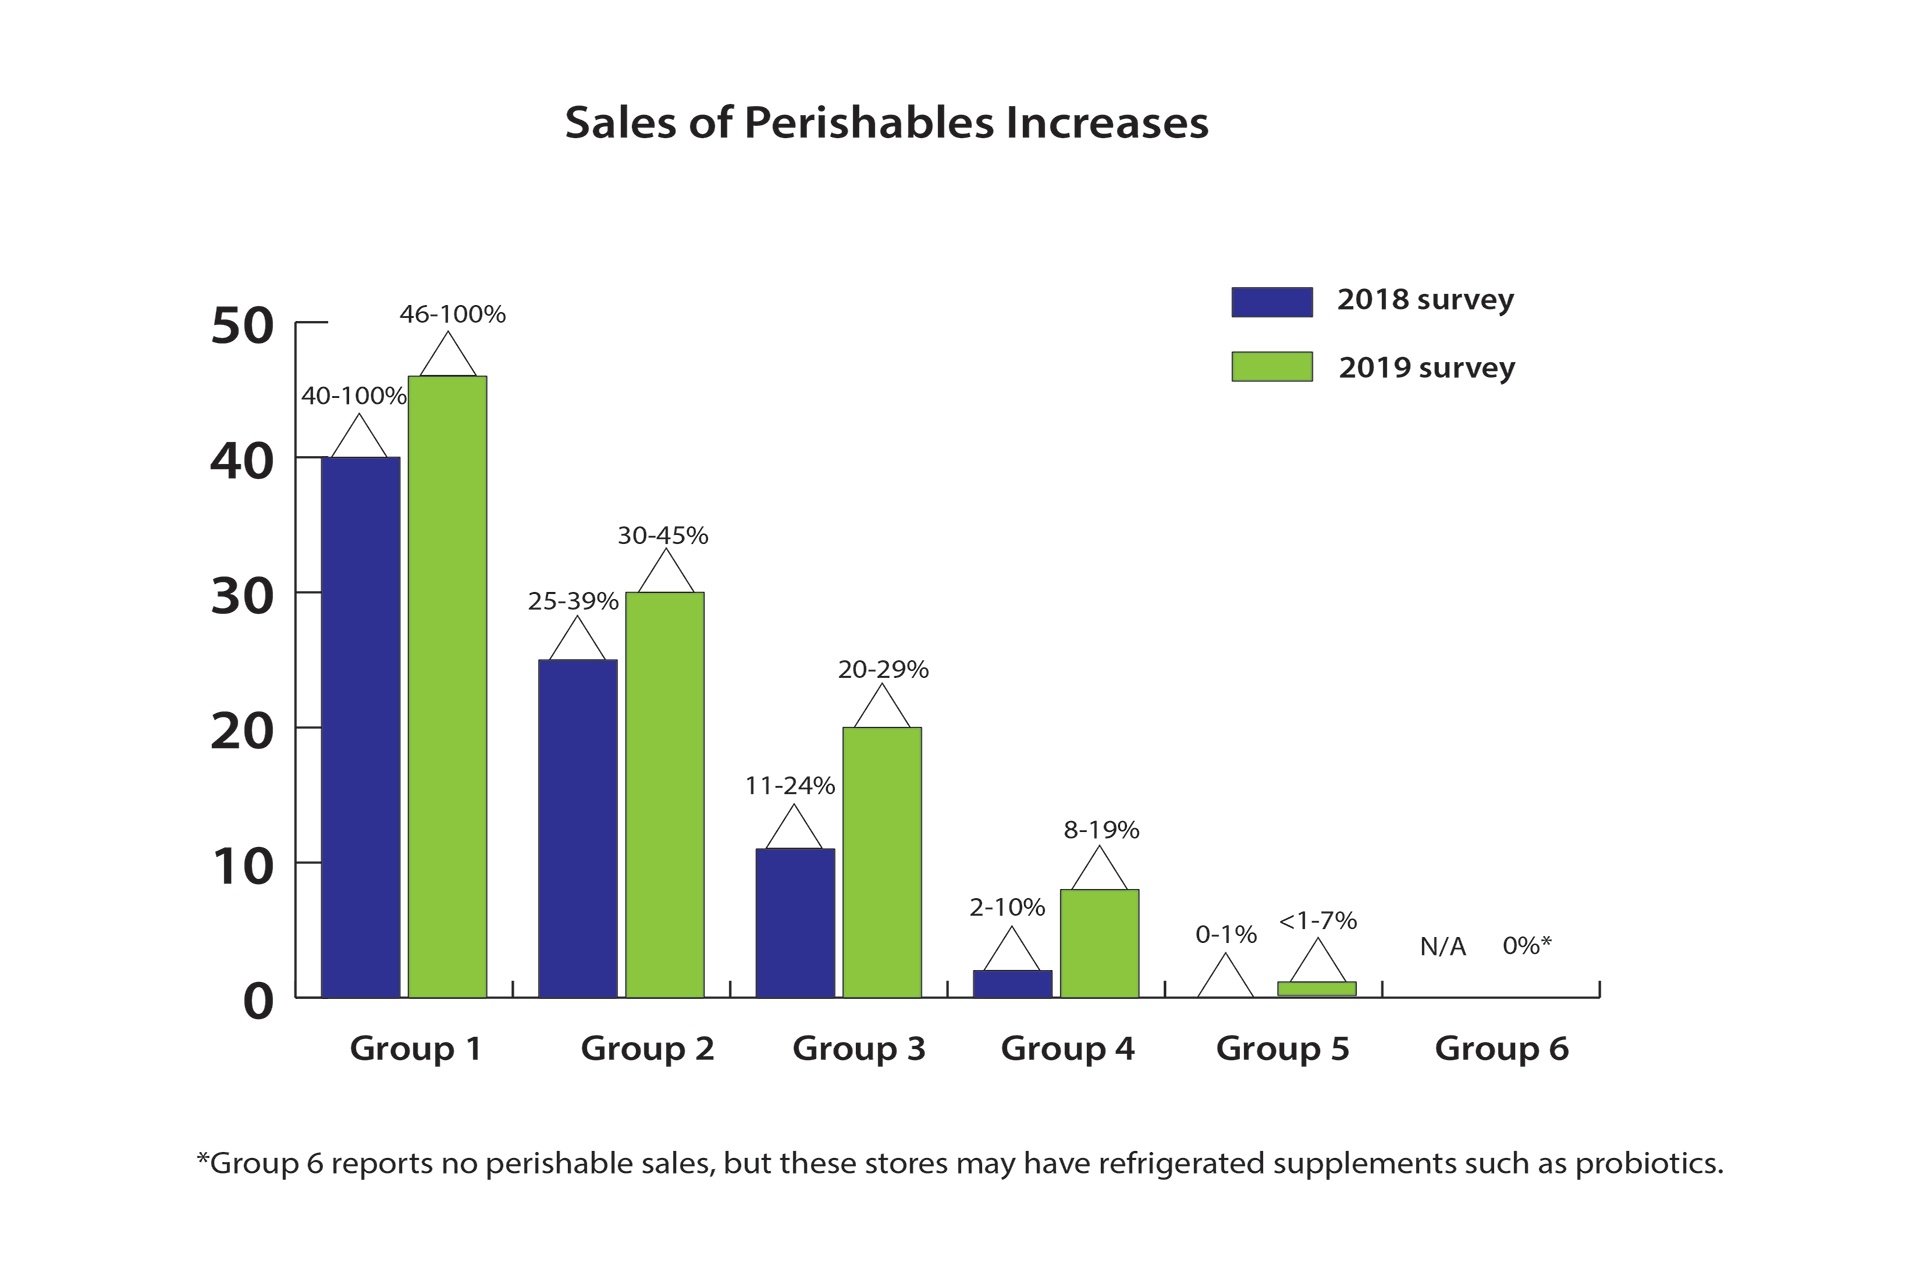
Category on the Rise: Perishables Retailers in this year’s survey told us they have increased the amount of fresh foods they sell, with each of the five perishables groups (Groups 1 through 5) reporting higher sales ranges for fresh foods. For example, this year Group 1, which represent the largest stores in the survey, sold a minimum of 46% perishables; last year, this group qualified for Group 1 status by reaching just 40% perishables. (See Figure 3.)
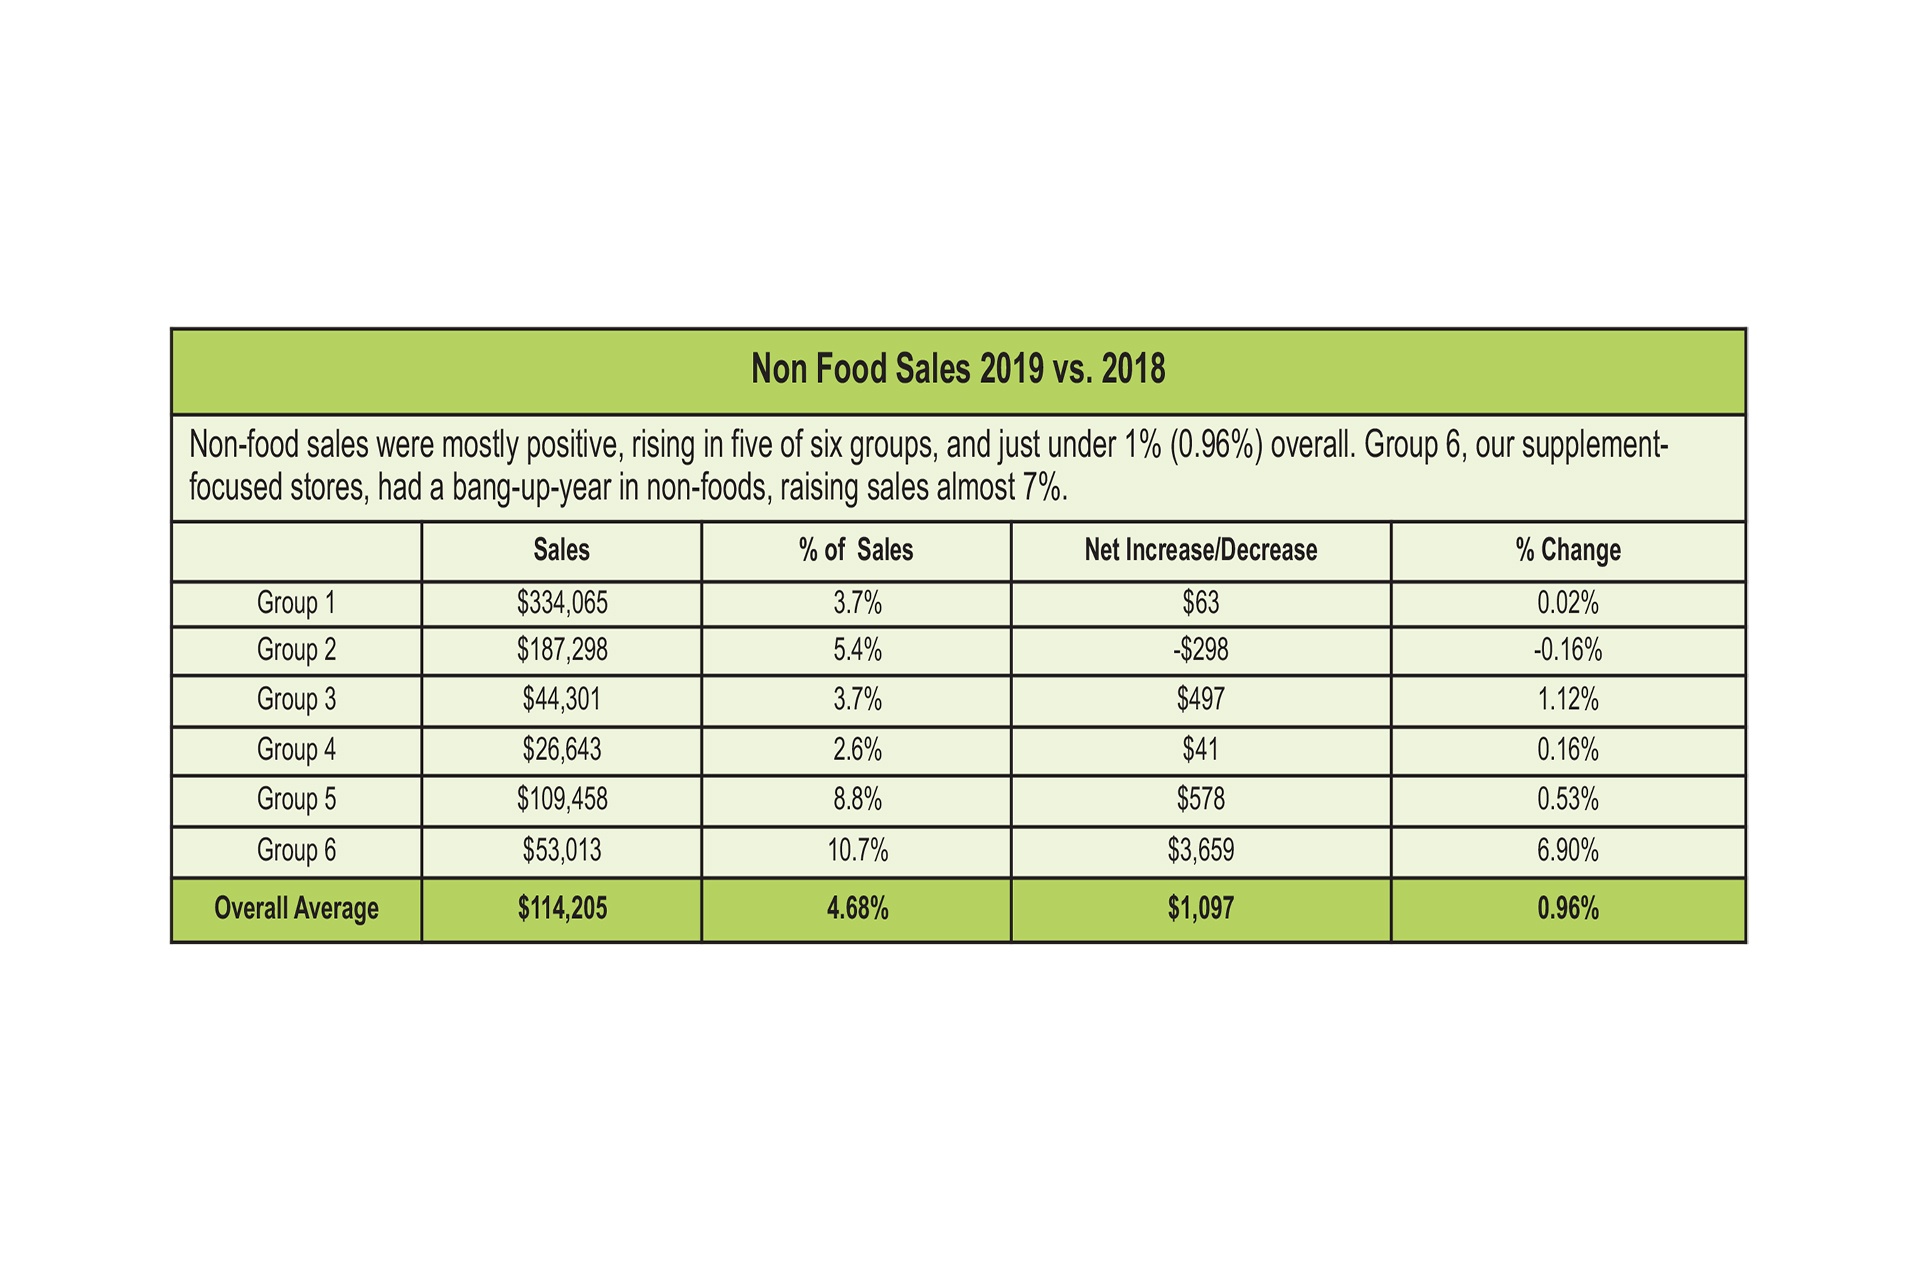
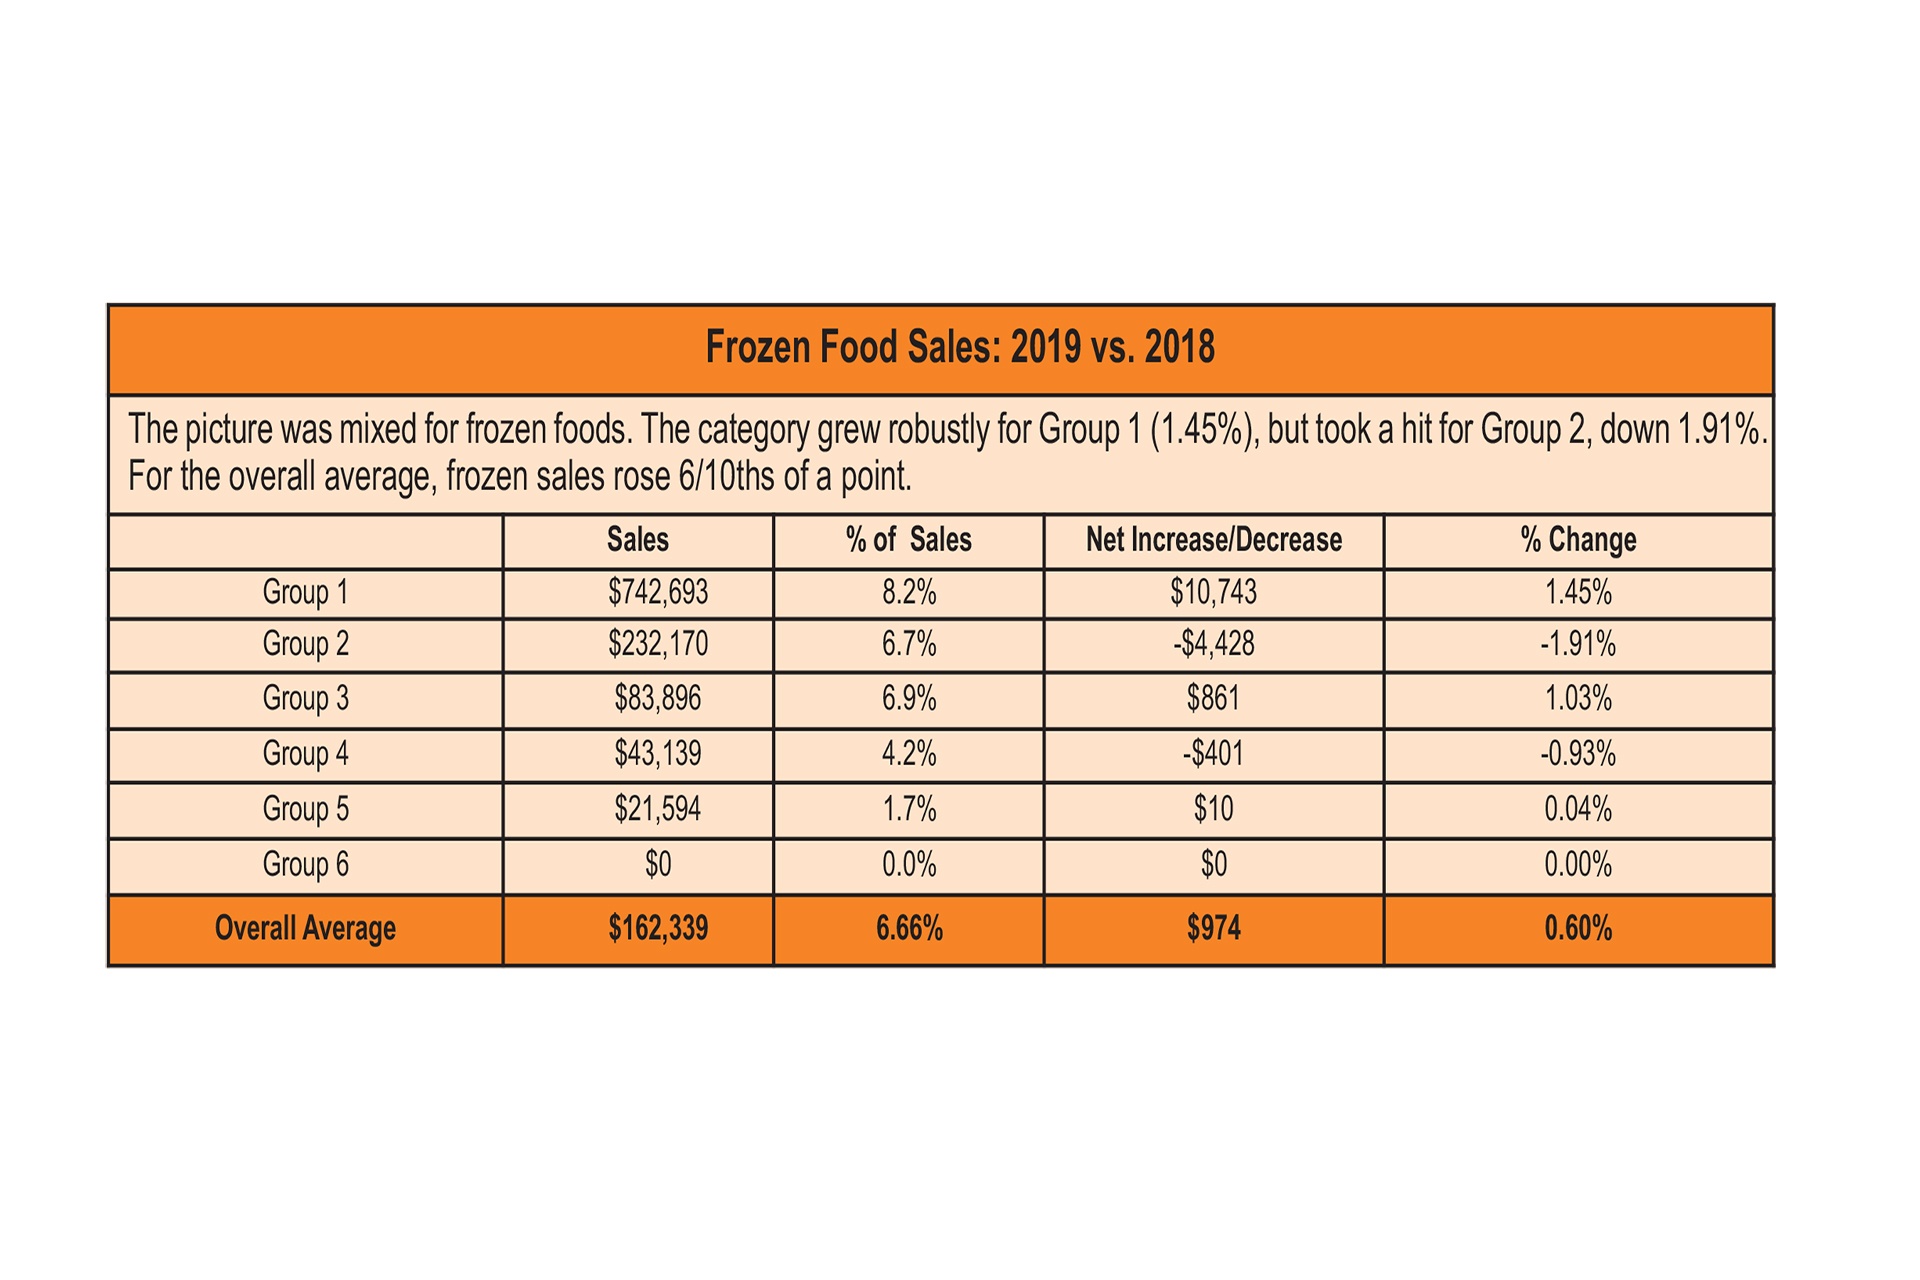
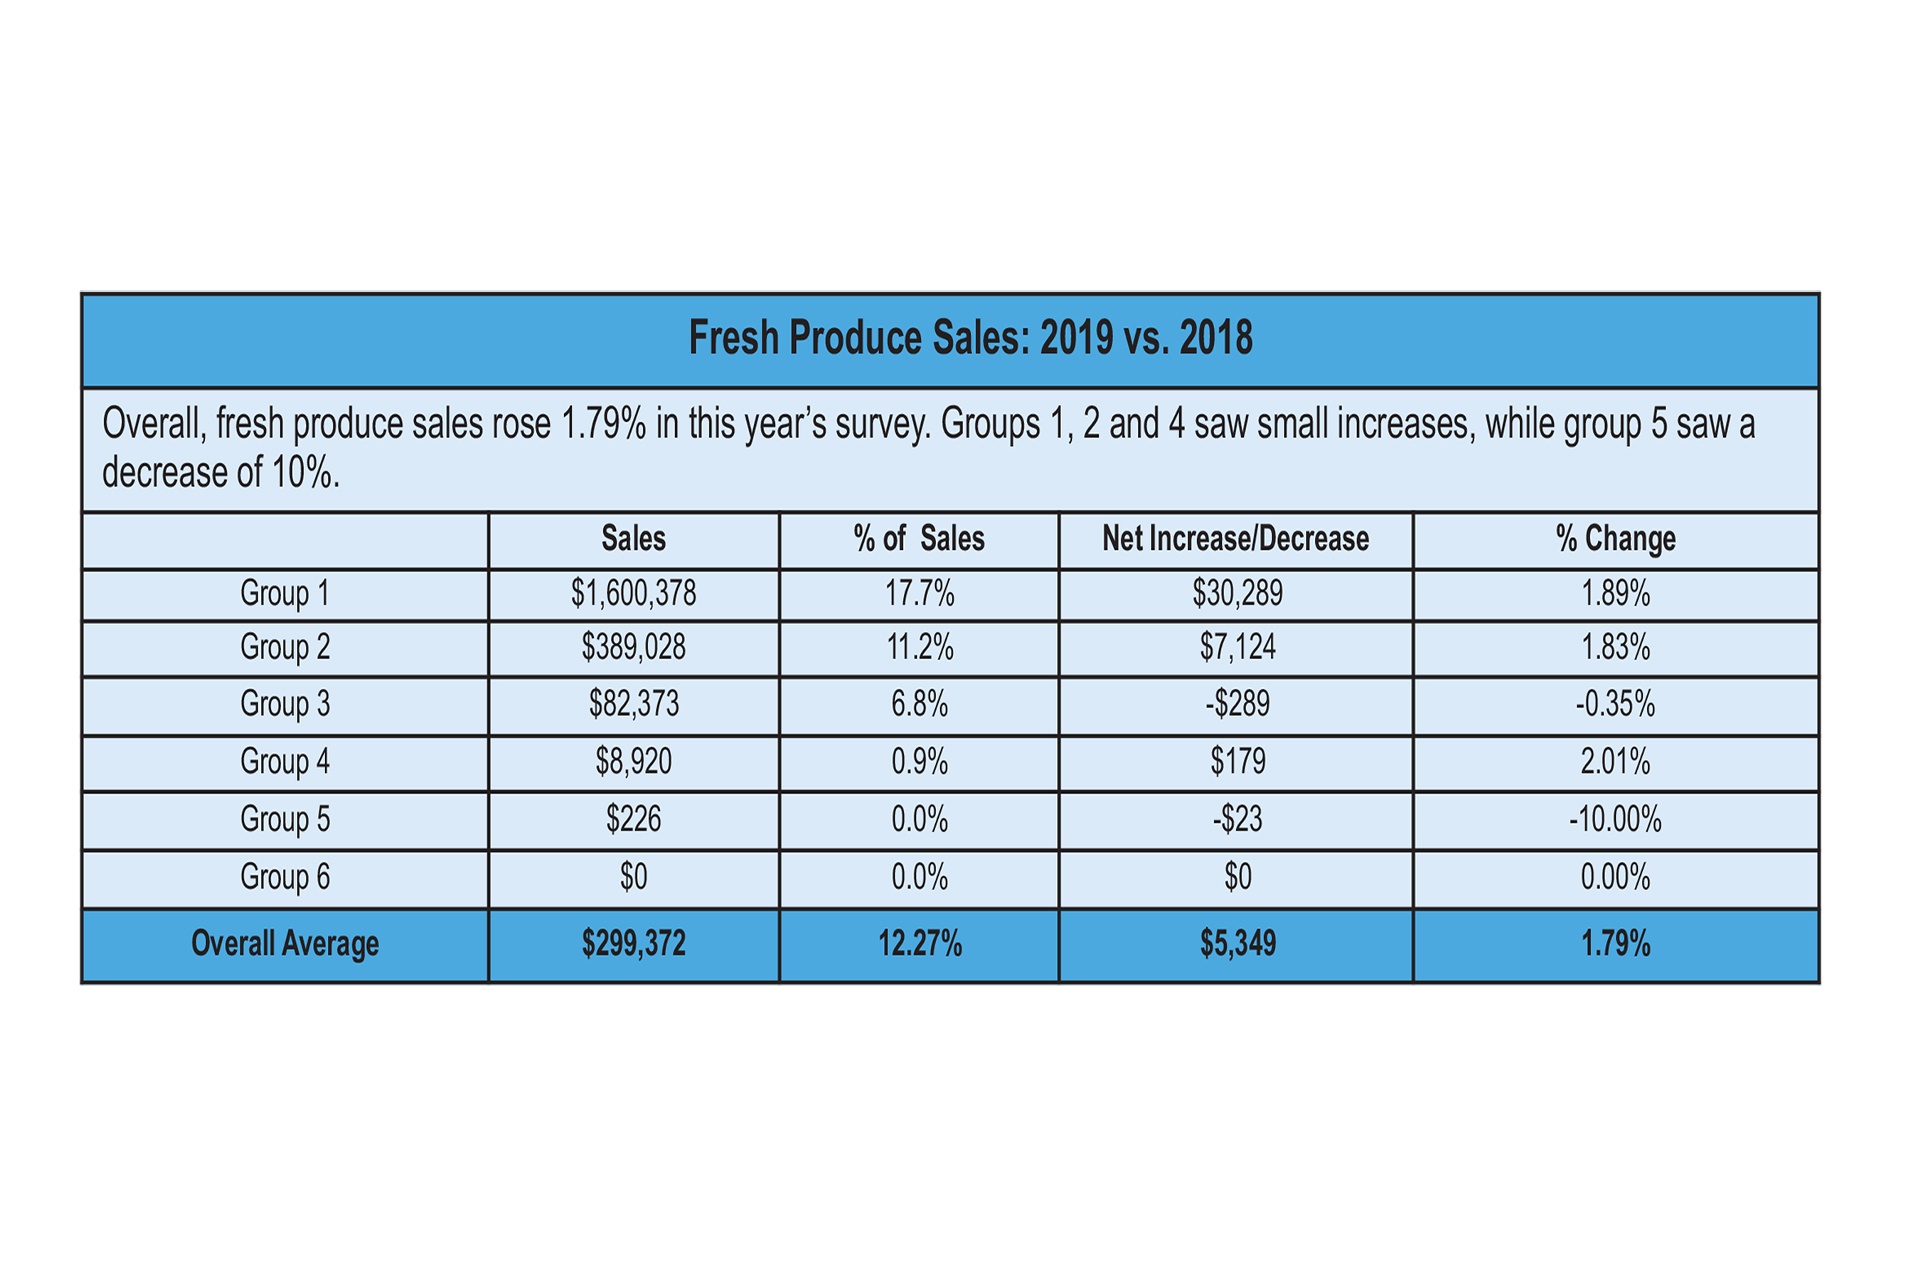
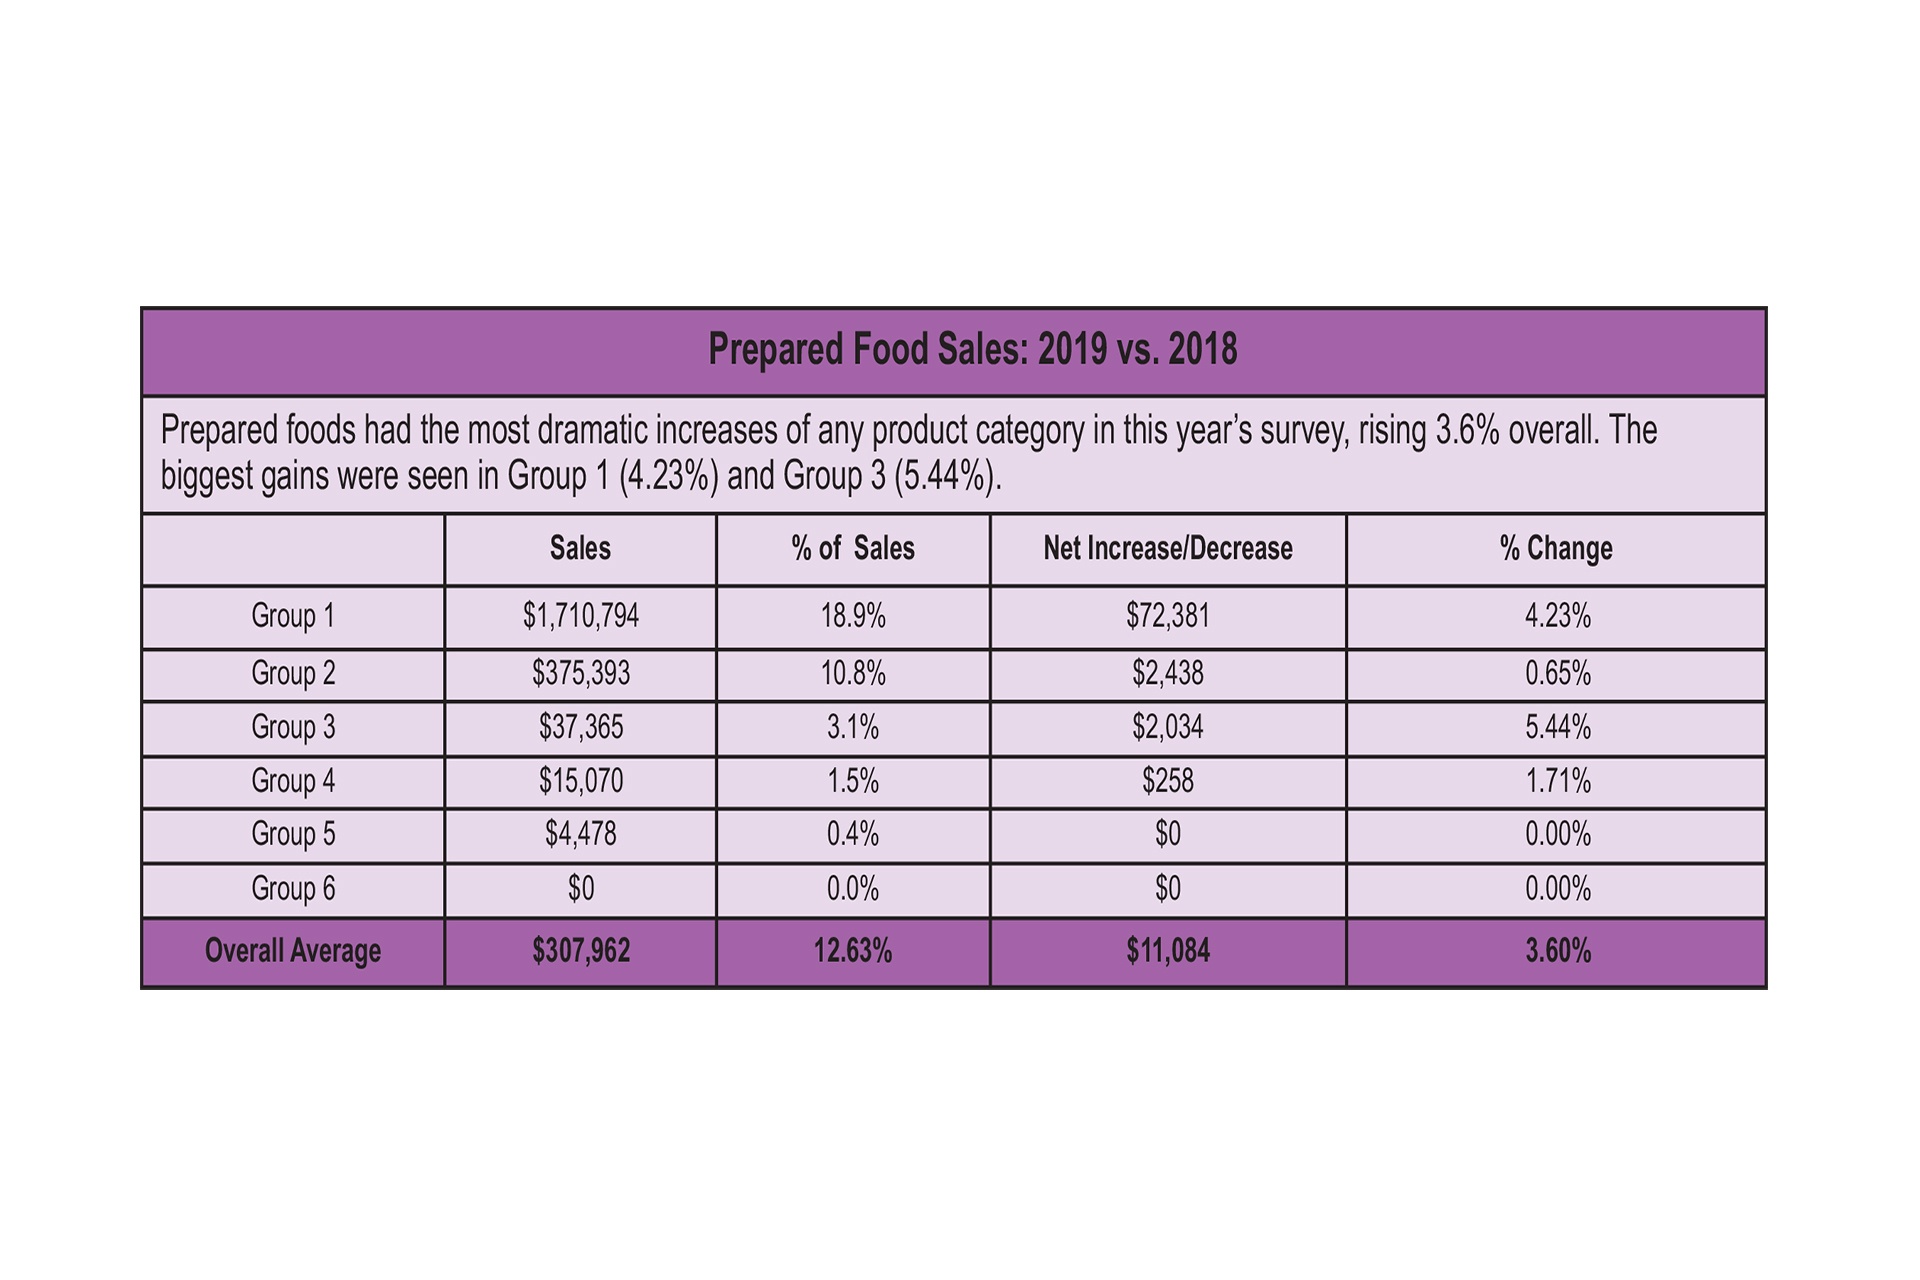
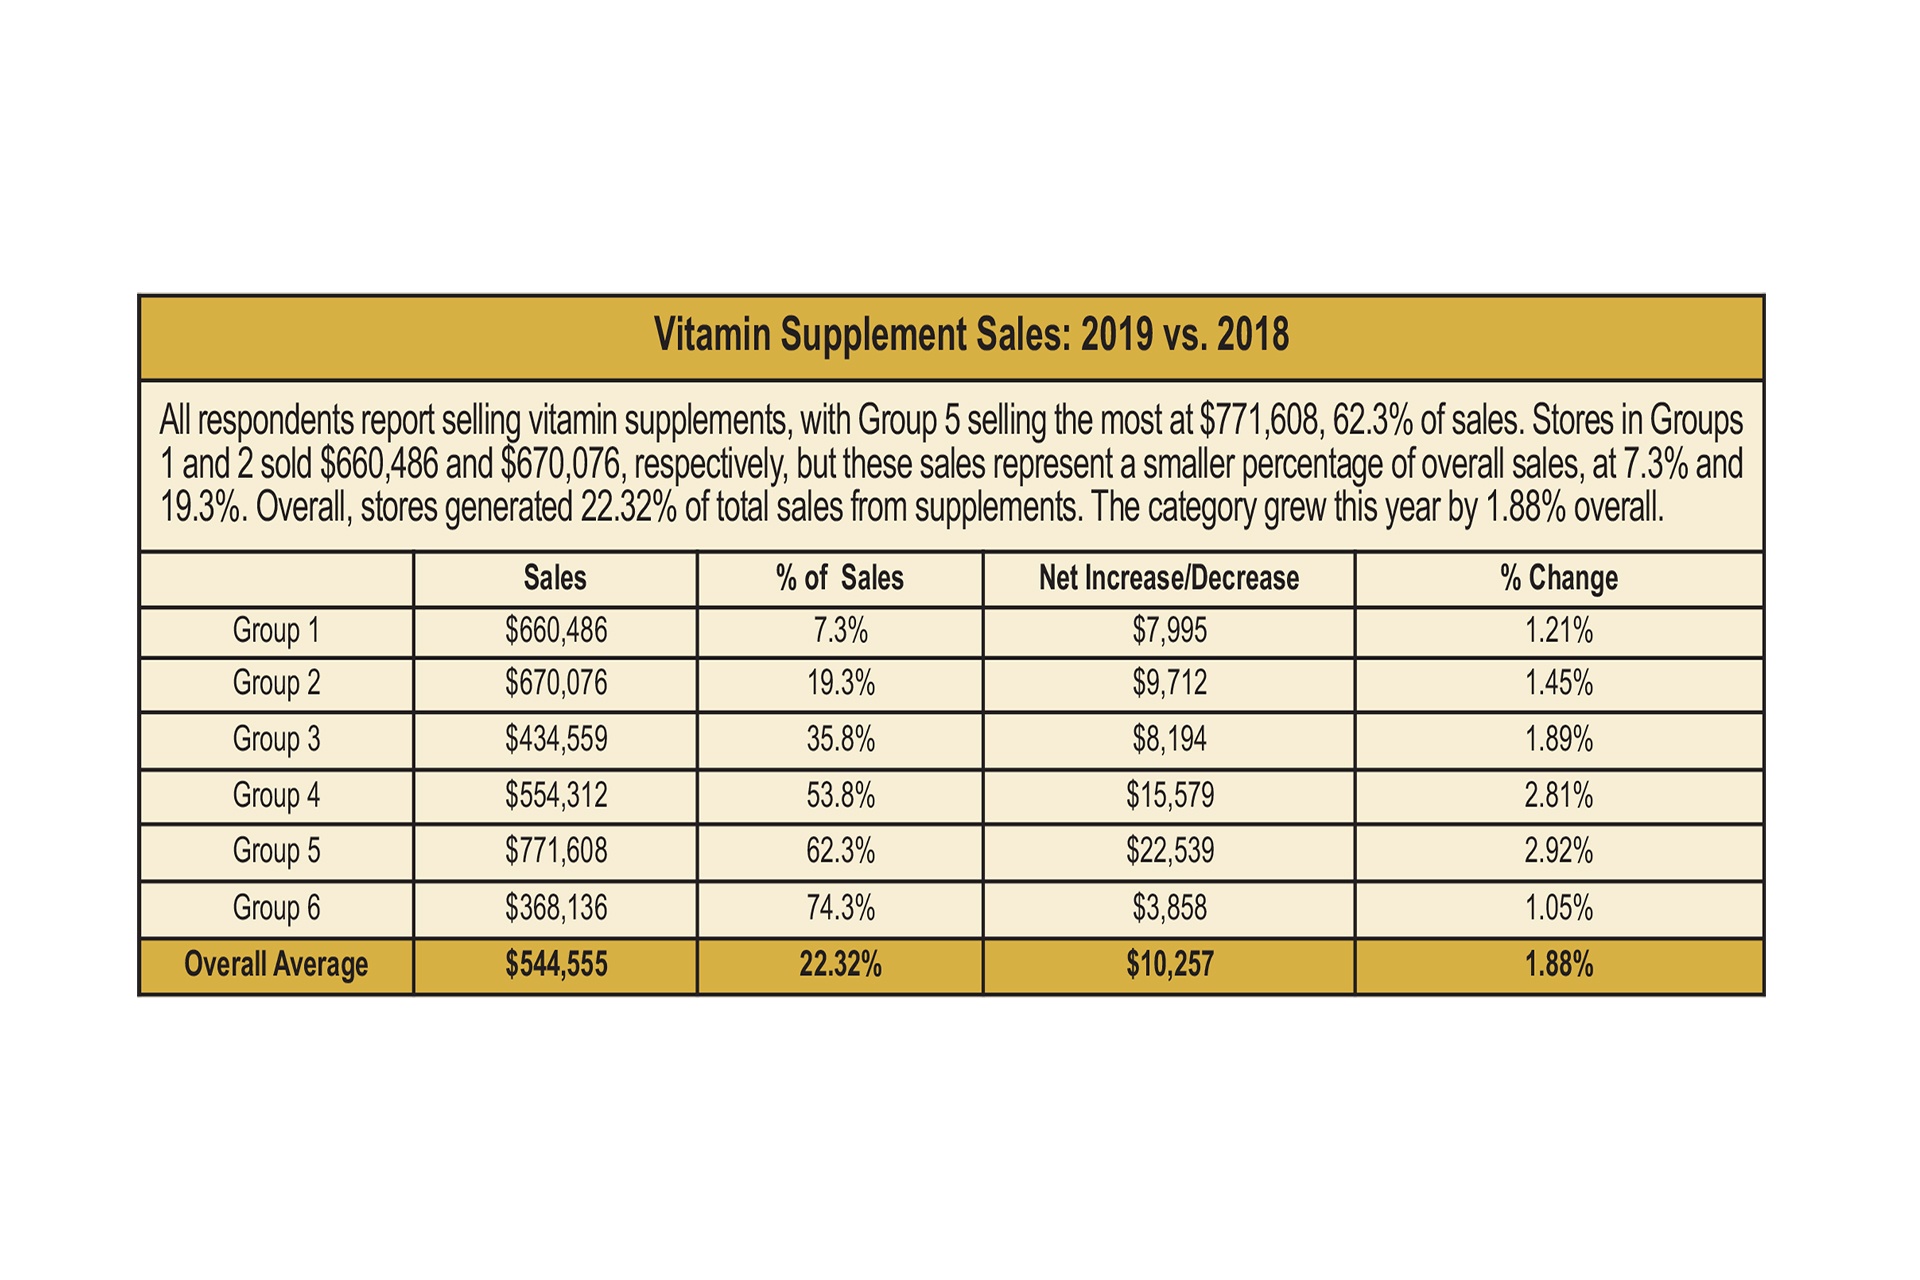
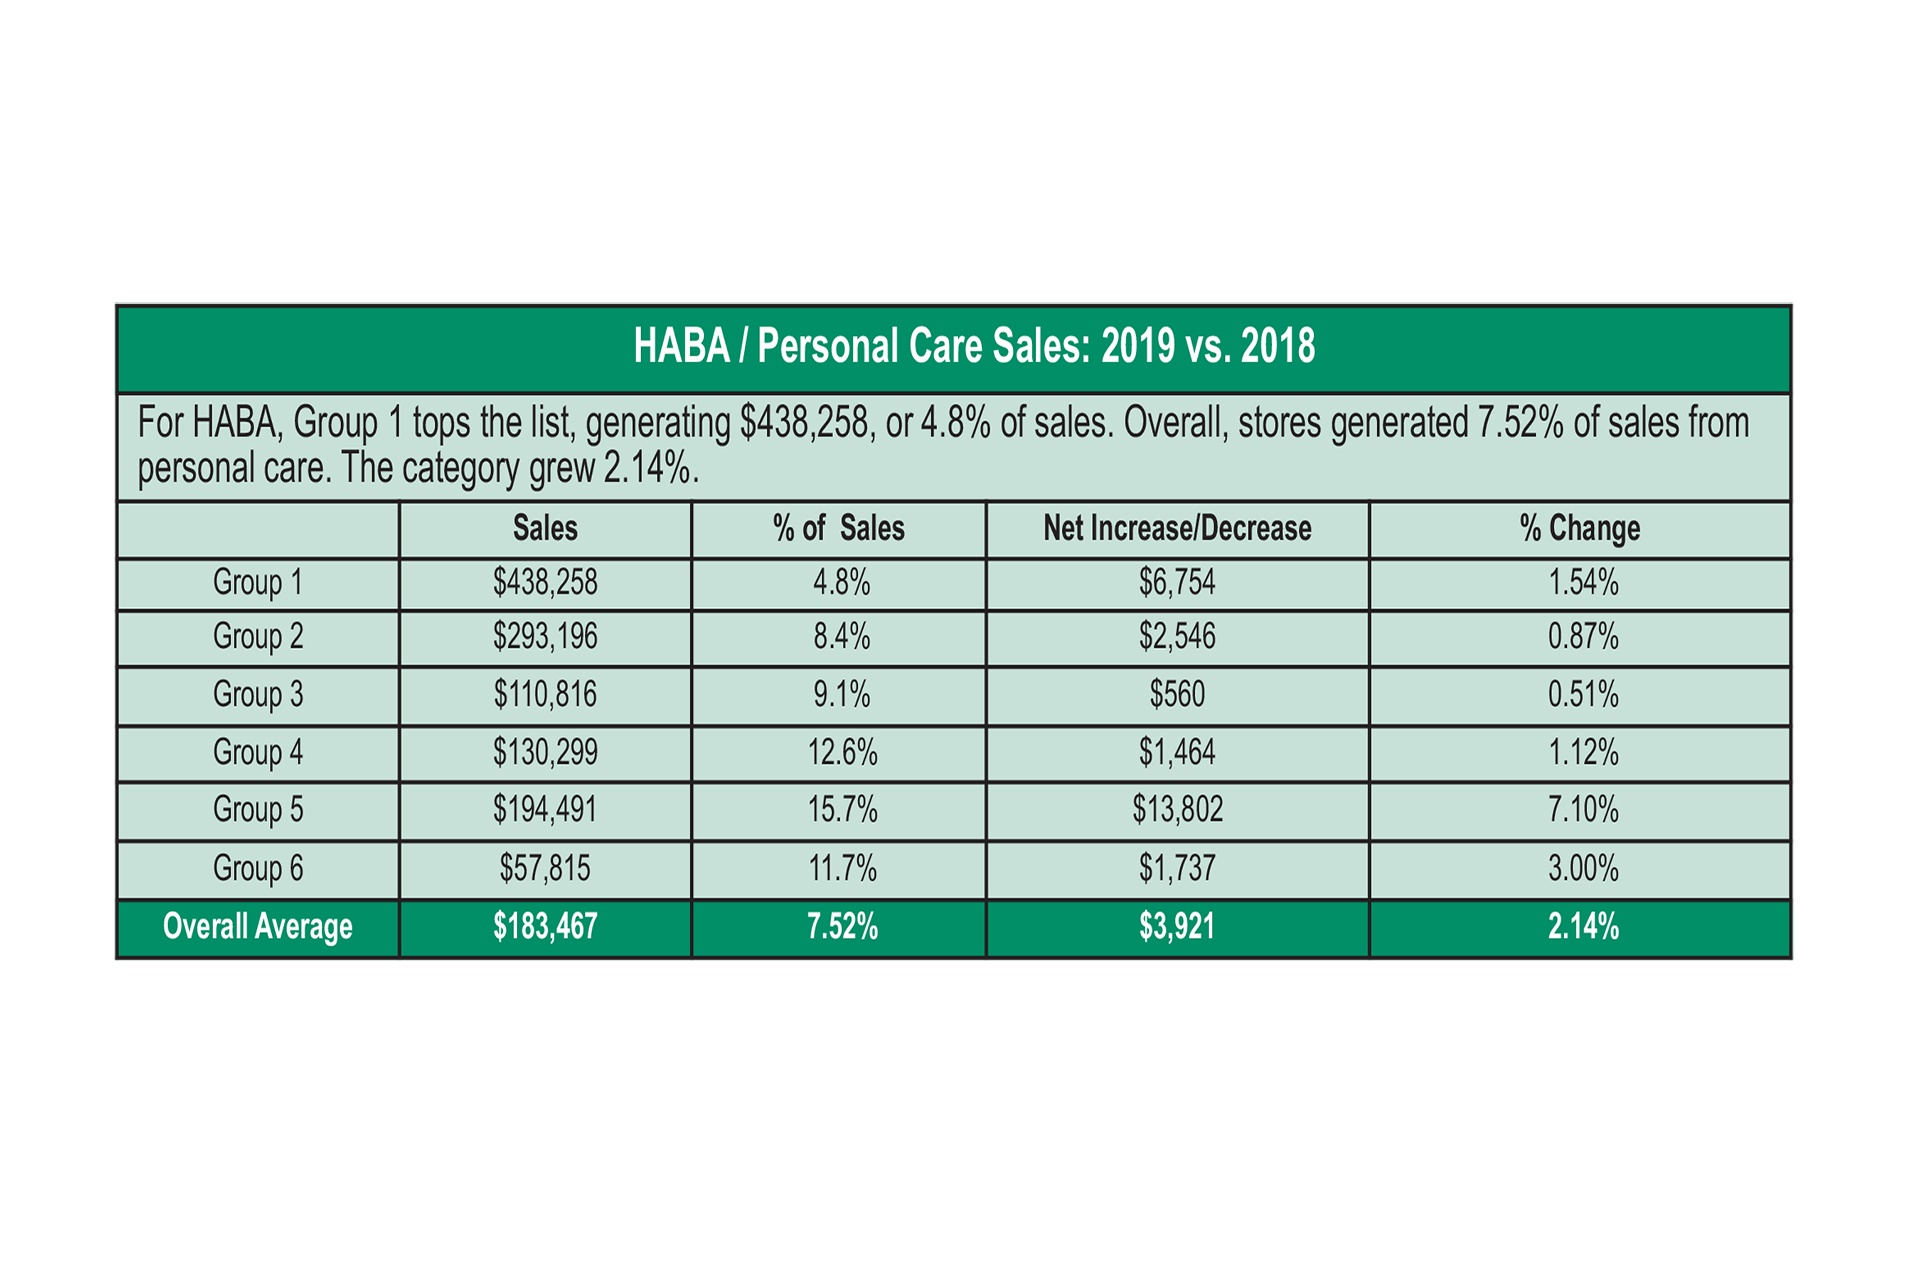
Sales by Department We asked retailers to tell us about their sales results in nine common product categories: dry grocery, refrigerated foods, frozen foods, fresh produce, prepared foods, bulk foods, non-foods, dietary supplements and personal care (HABA). What the responses revealed: On average overall, supplements are the largest single department, at 22.3% of sales, followed by dry grocery, at 19.1%. Prepared foods come in next at 12.6%, followed by fresh produce at 12.2%, refrigerated foods at just under 10%, personal care/HABA at 7.5% and frozen foods at 6.6%. The two smallest categories in this year’s survey, just as in last year’s, are bulk food at 4.8% and non-foods at 4.6%.
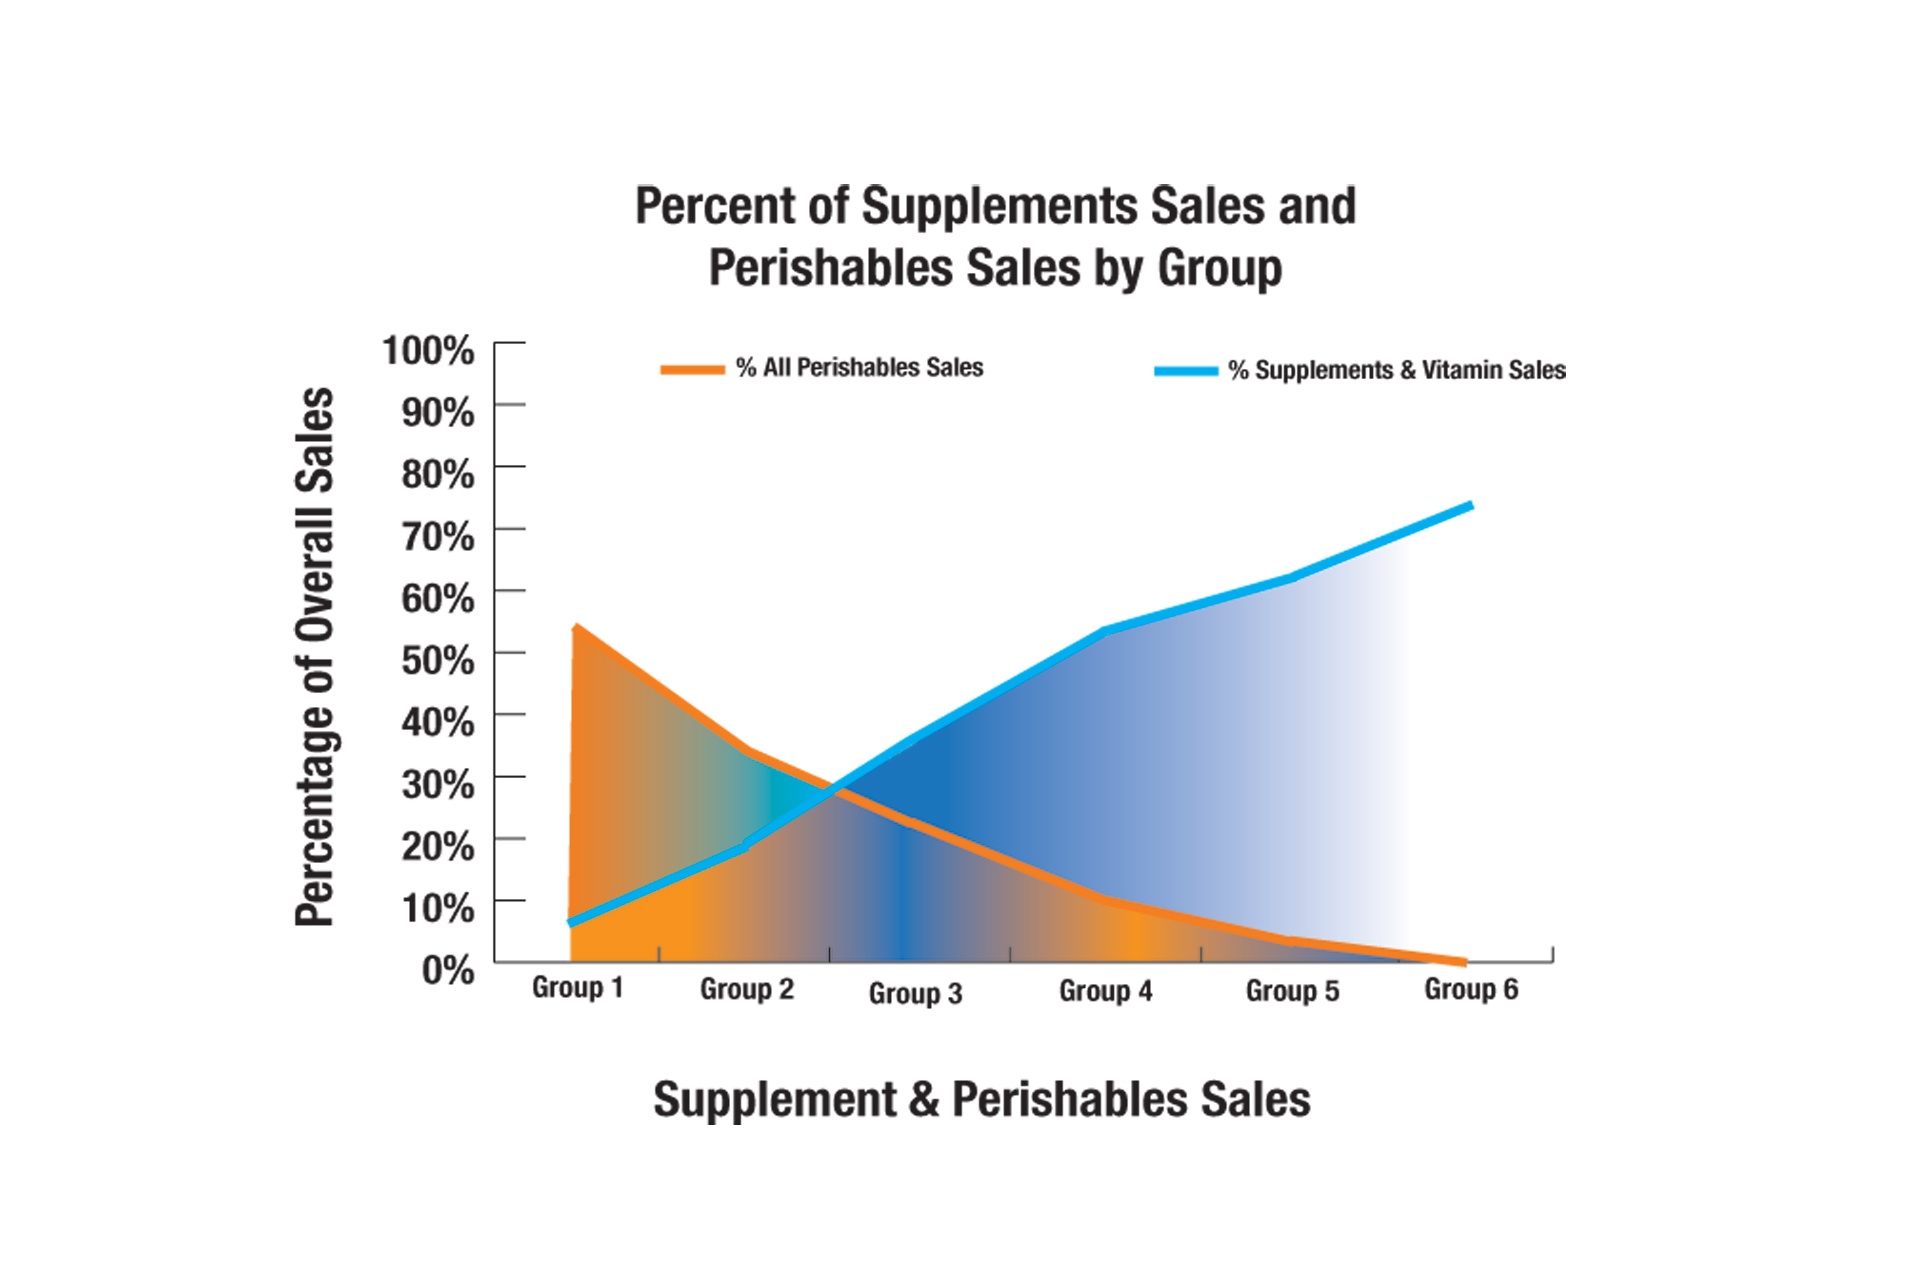
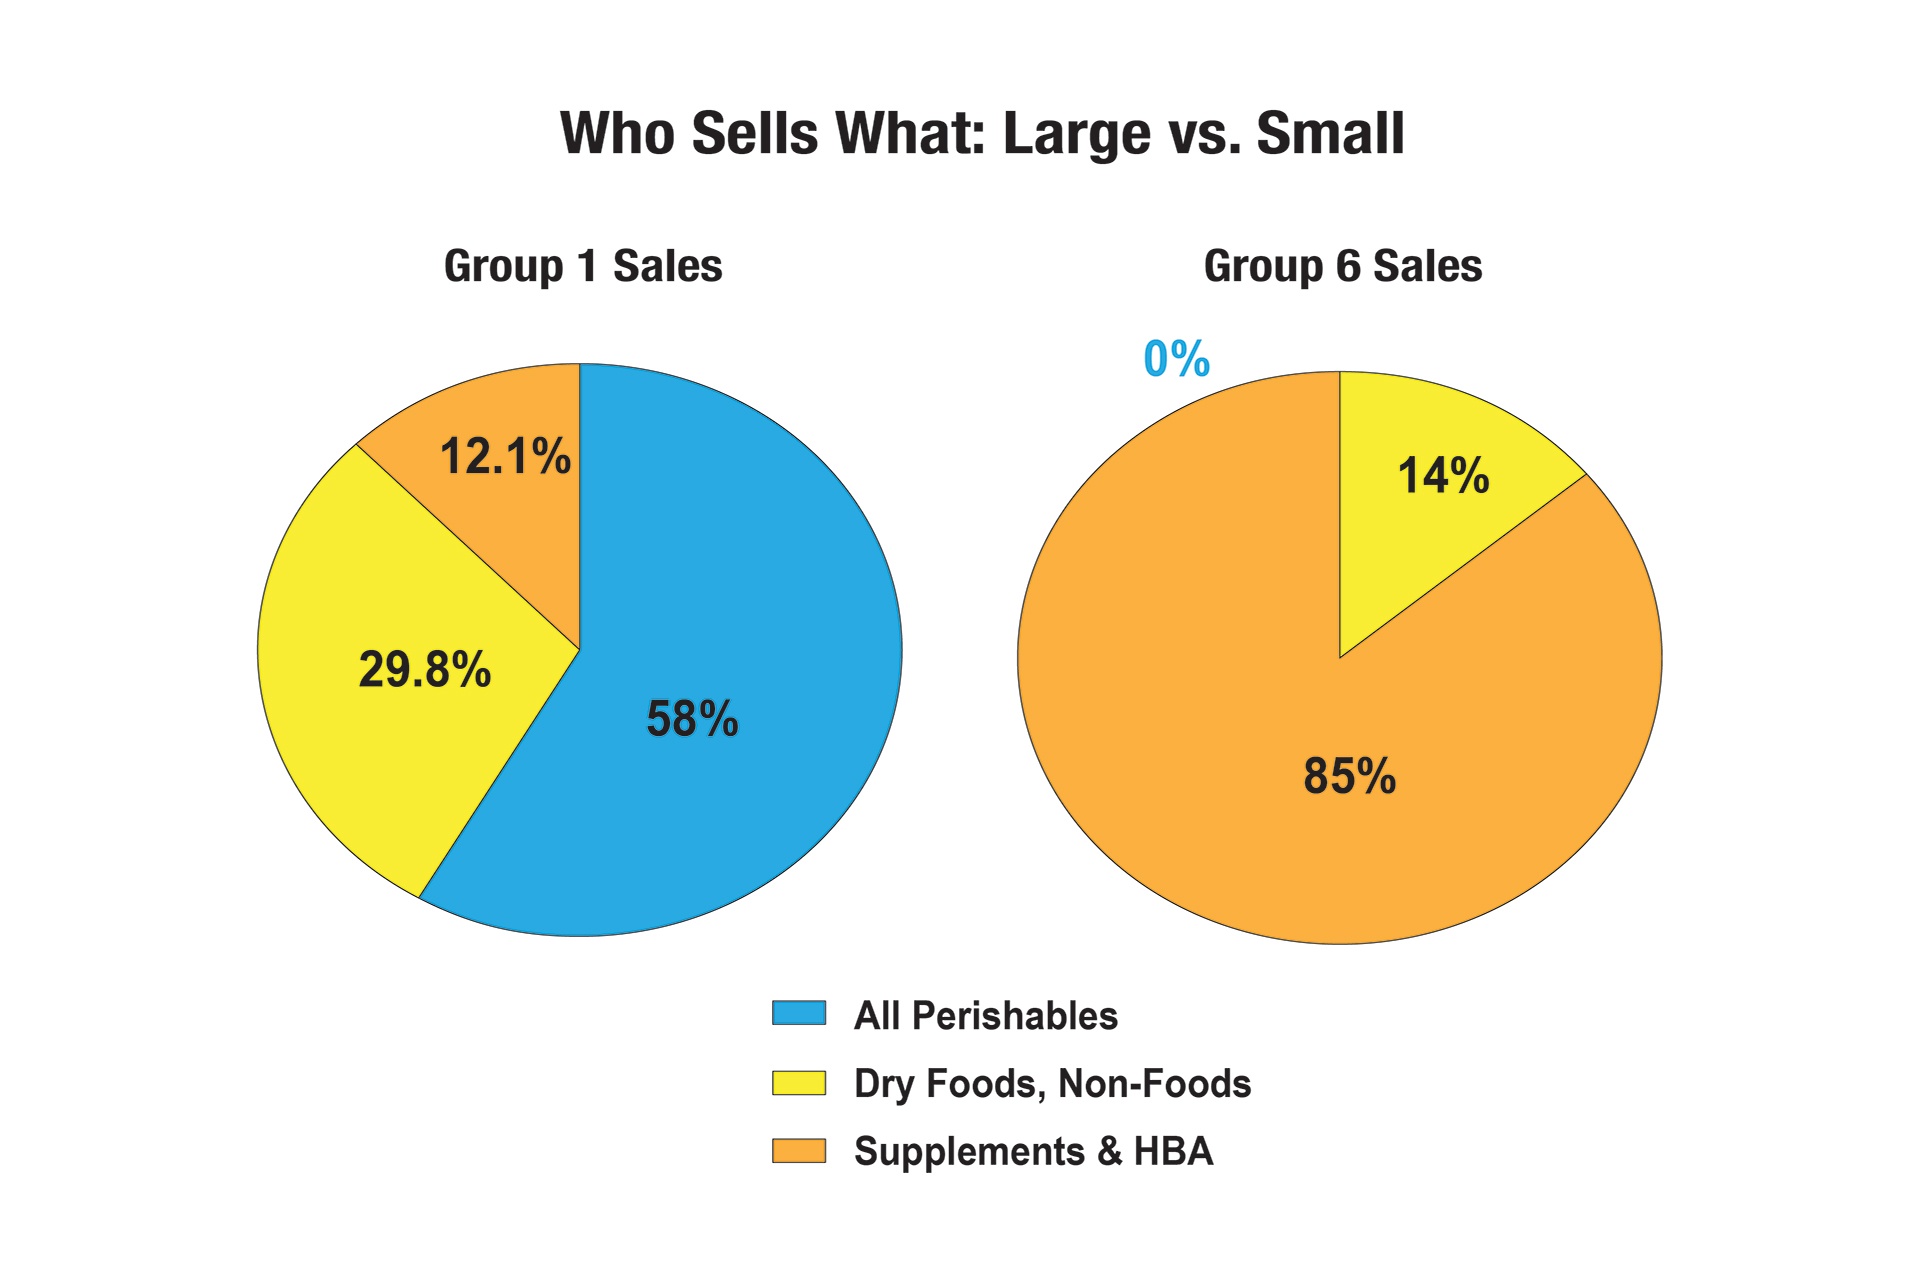
Surveys from years past have shown that those independent natural retailers that sell fewer perishables sell many more vitamins and supplements. This trend was confirmed again this year. Group 1 stores sell 58% perishables and just 7.3% supplements. Group 6 is the reverse, selling 0% perishables and 74.3% supplements. (See Figures 4 & 5.)
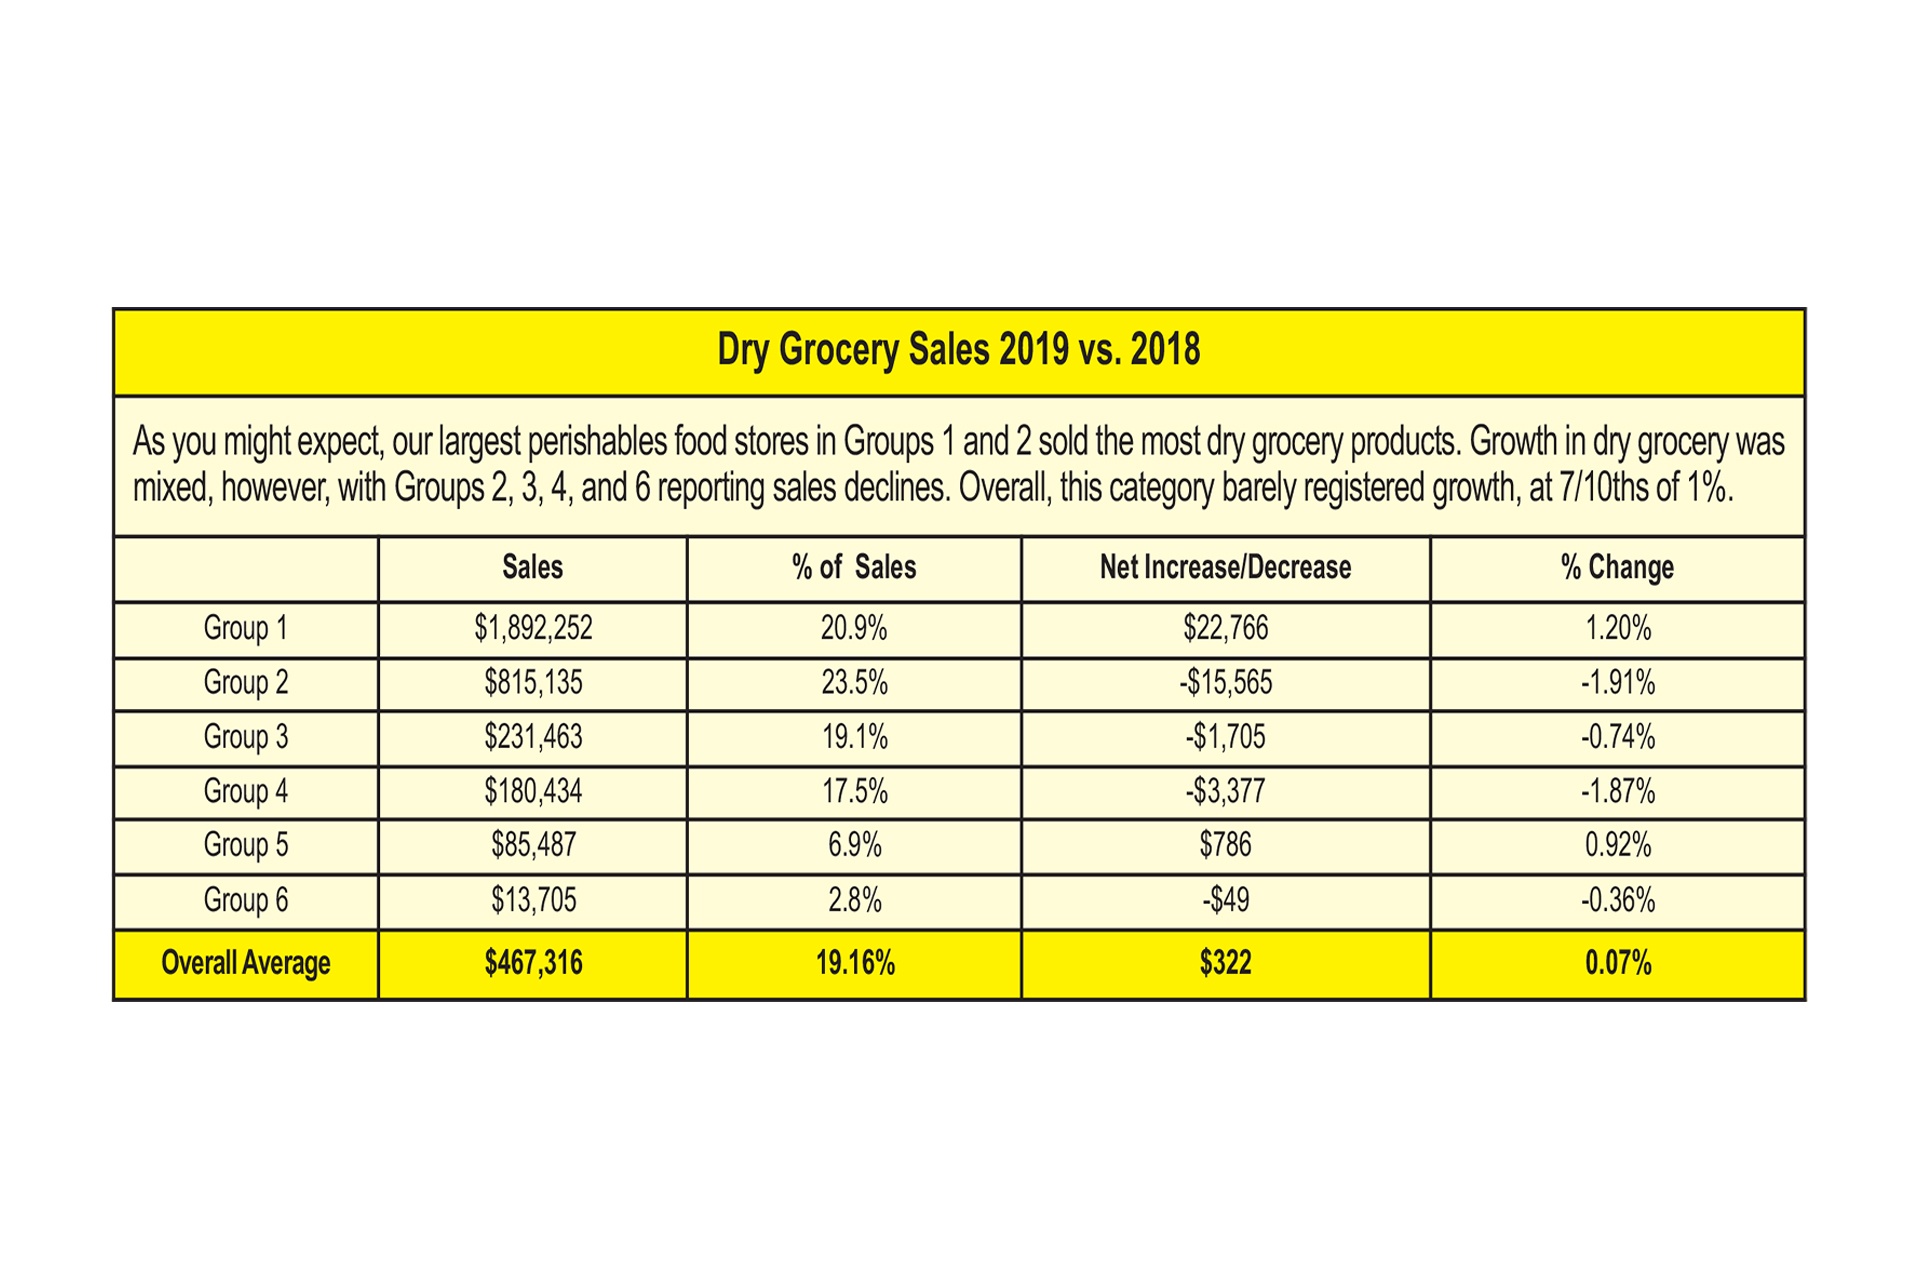
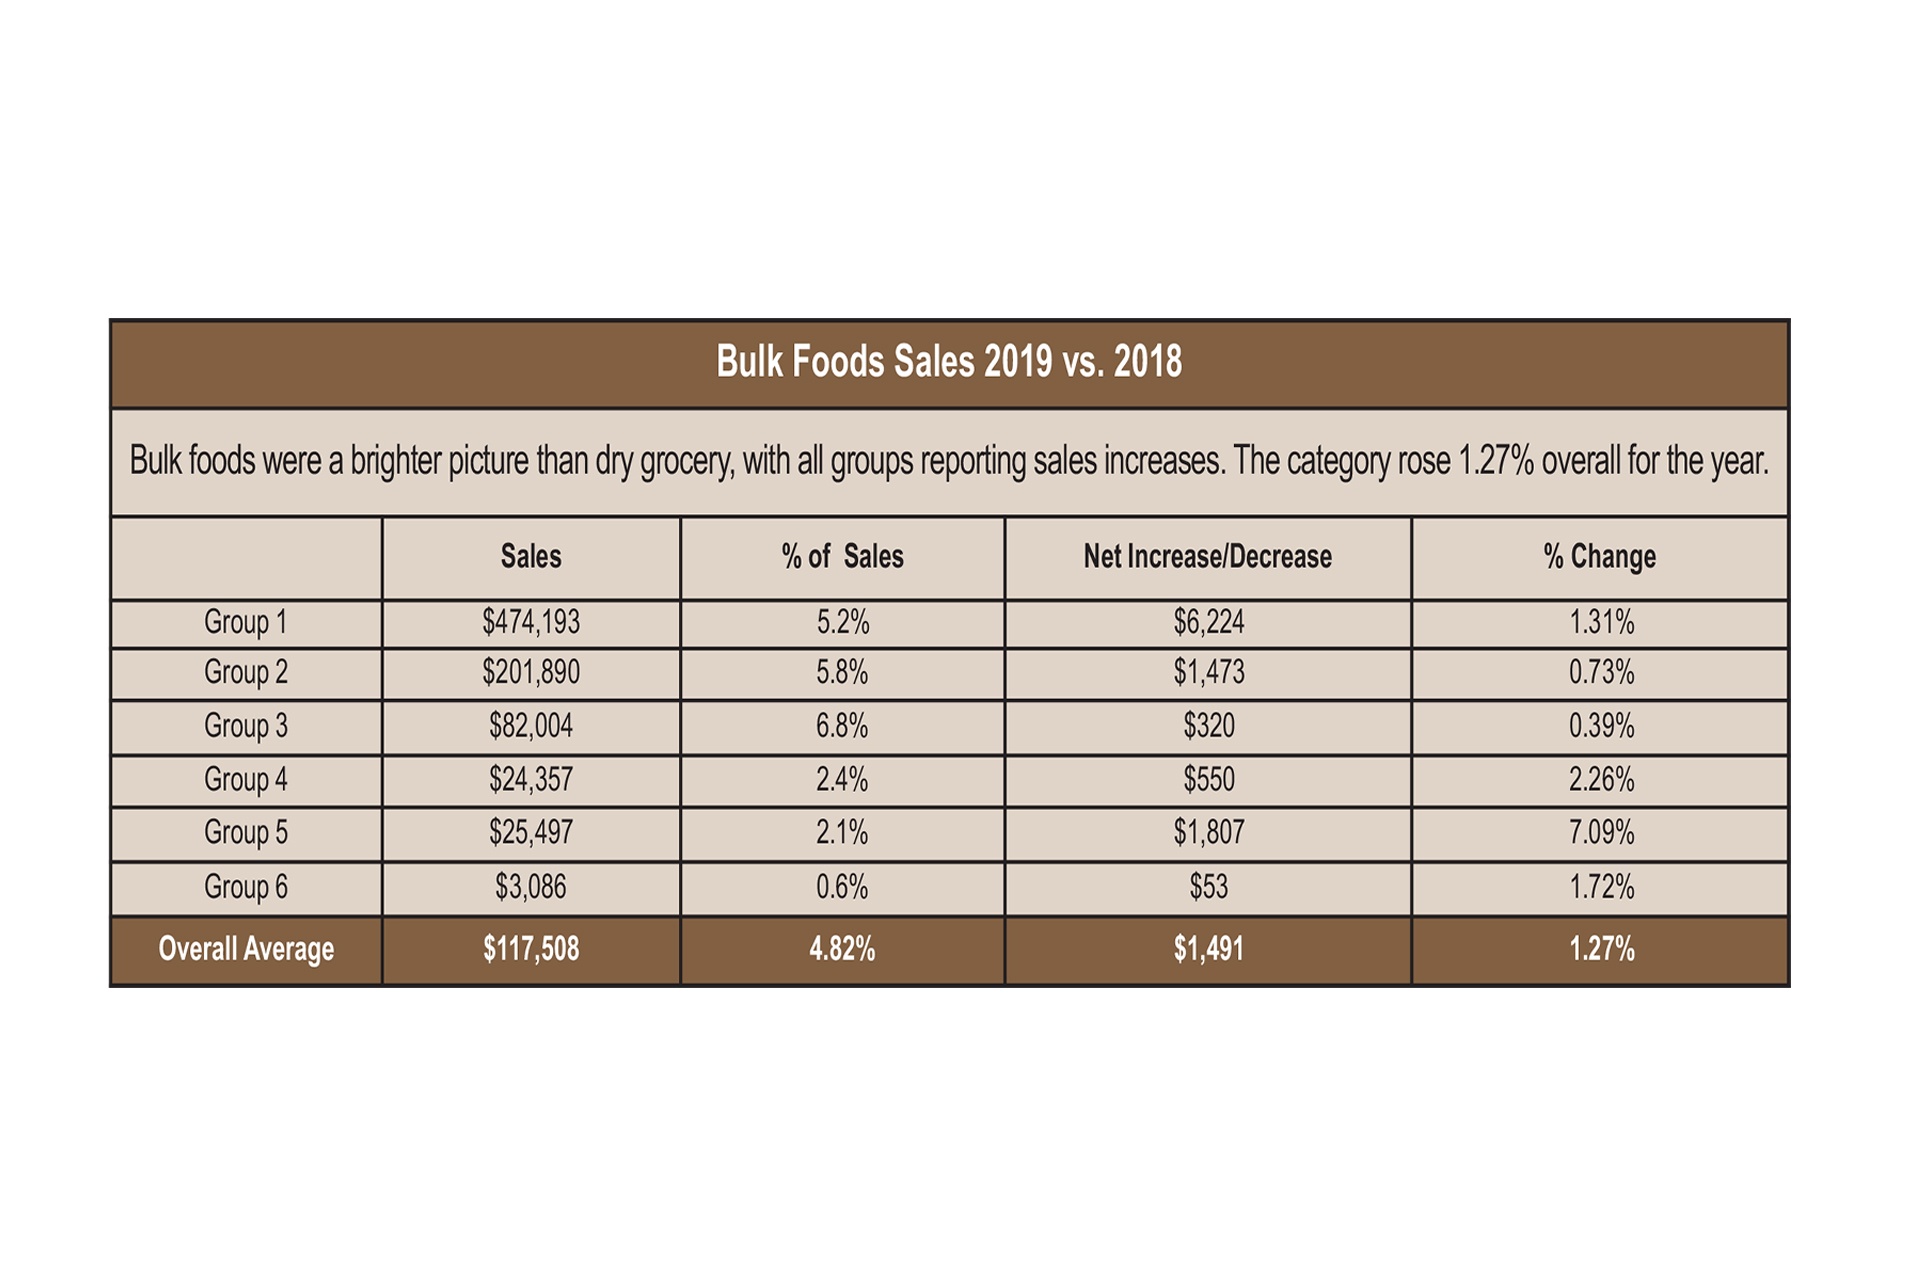
On the food front, as you might expect, our largest perishables food stores in Groups 1 and 2 also sold the most dry grocery products, at $1,892,252 and $815,135, respectively. The same is true for bulk foods and non-foods sales. Dry grocery and bulk foods make up more than a quarter of sales for Groups 1, 2 and 3, but less than 10% for Groups 5 and 6. Refrigerated and frozen foods combined represented over 15% of sales for Groups 2 and 3, and rose to 21.4% for Group 1, but were less than 10% of sales for Groups 4, 5 and 6. Fresh produce and prepared foods sales, combined, reached 36.6% of sales for Group 1, and 22% of sales for Group 2, but fell below 10% for Groups 3, 4, 5 and 6.
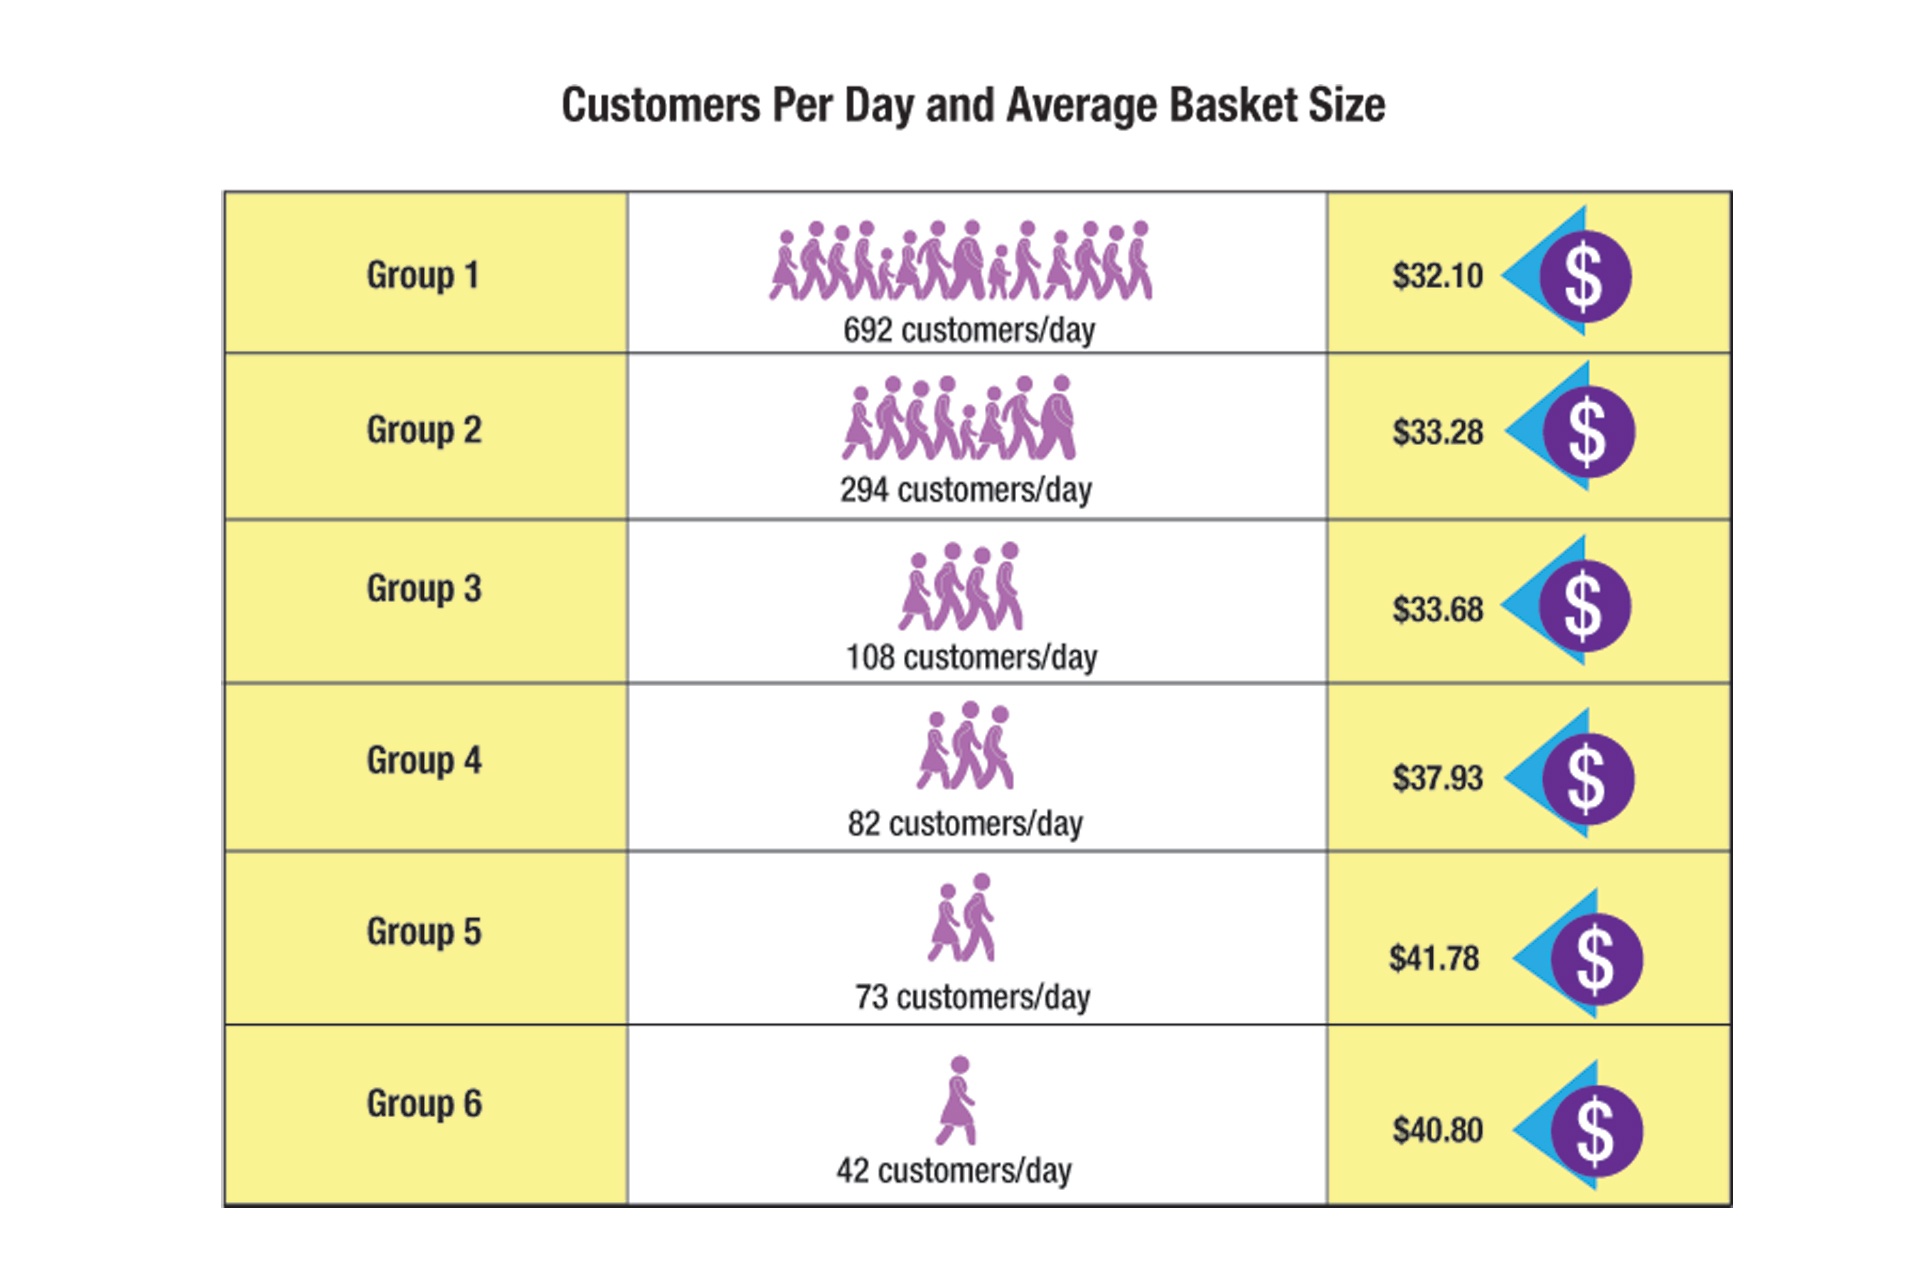
Customers and Transactions As you might imagine, as store size increases, so do the number of customer transactions per day. Stores in Group 1 see nearly 700 shoppers daily (692) on average, with stores in Group 2 seeing less than half that number, at 294 register rings. While customer counts increase as store size increases, the opposite is true for average transaction value; the larger the store, the smaller the average transaction. Stores in Group 1 have the smallest average transaction, at $32.10 per register ring, while our supplement-focused stores in Group 5 enjoy the largest average ticket, at $41.78. (See Figure 6.)
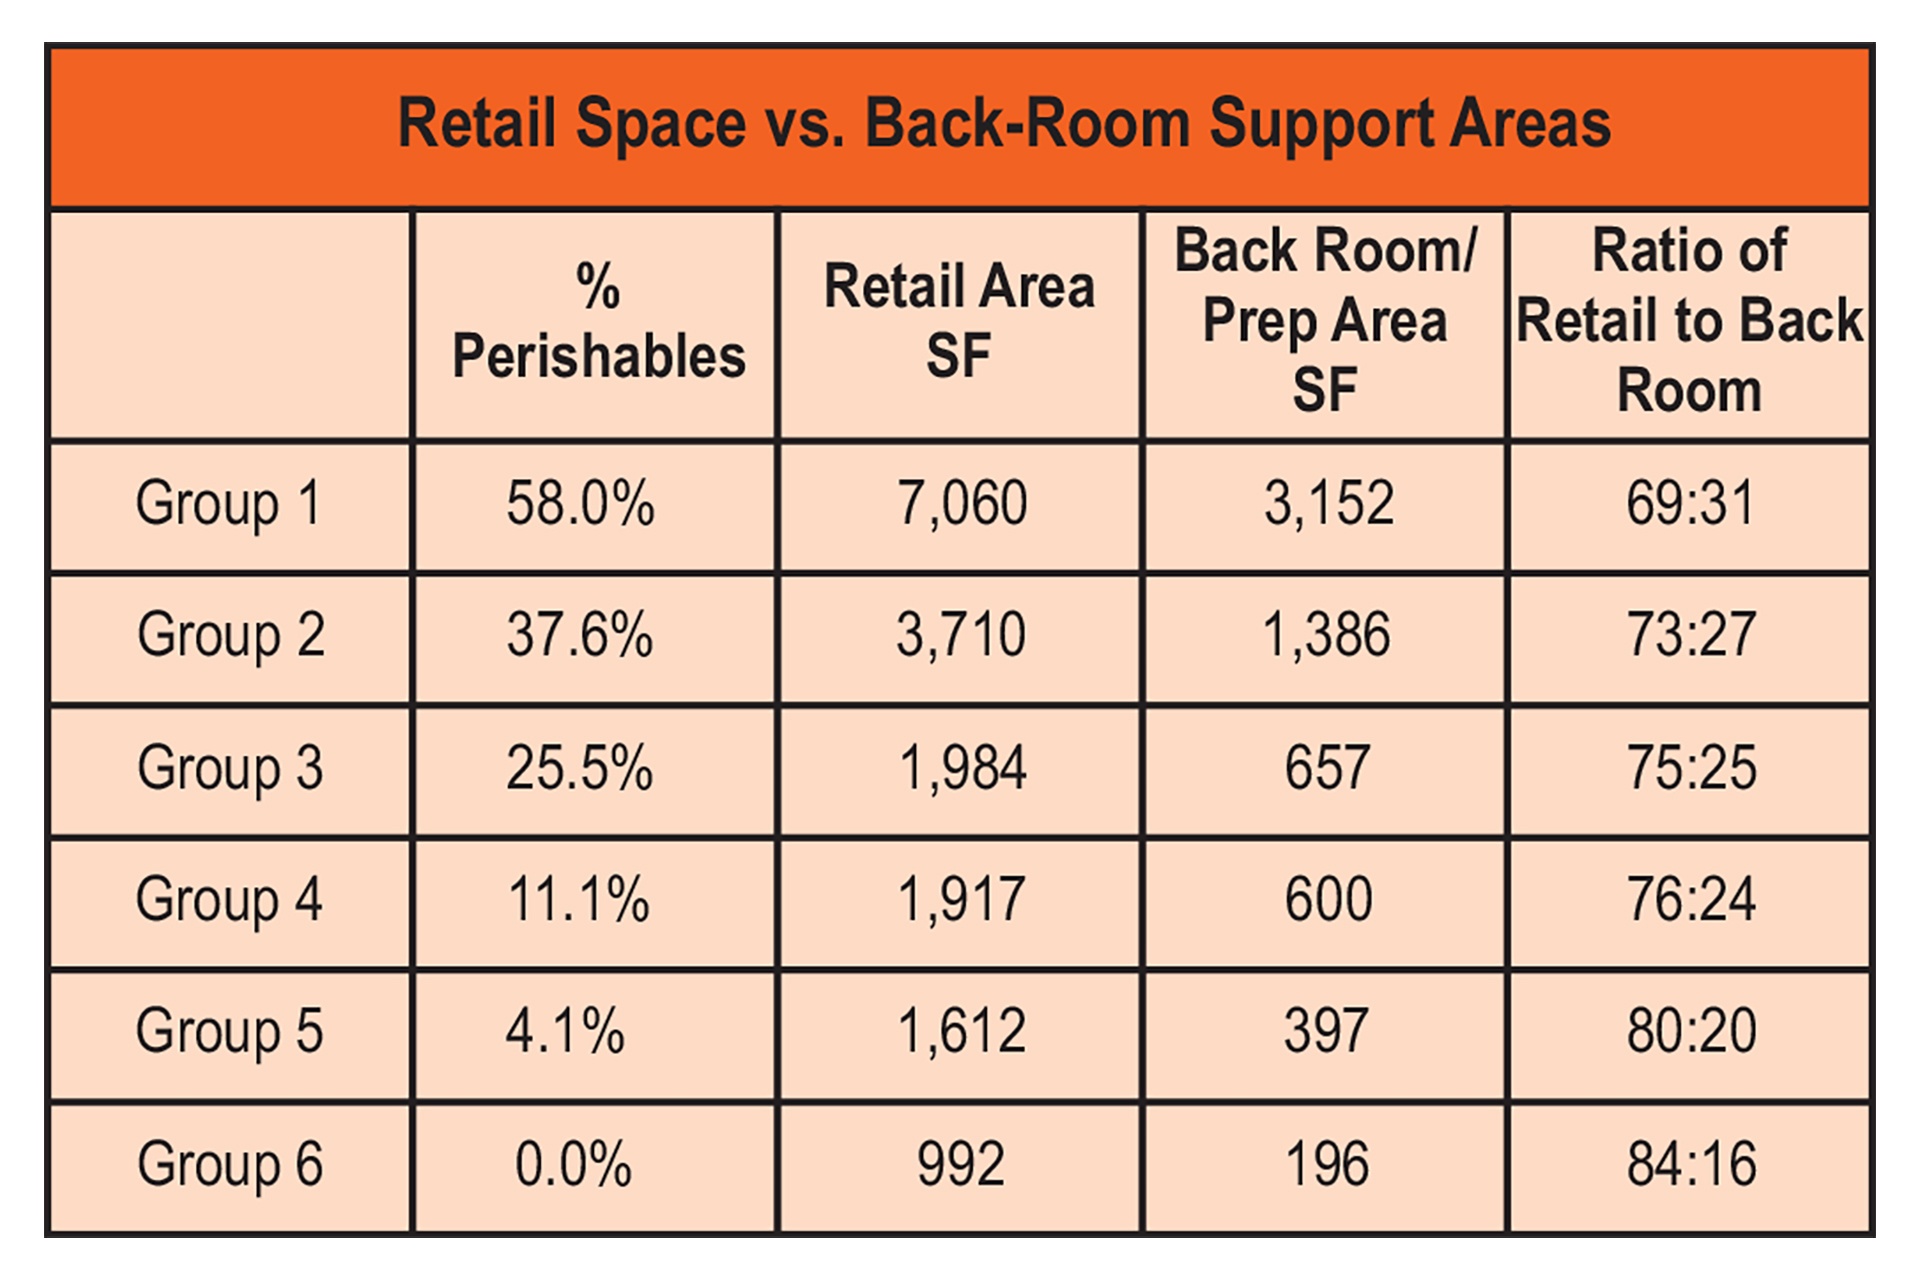
Breakdown of Store Space It takes more room to sell perishables because support areas must have more walk-in cooler and freezer space, larger areas for preparing produce, and more kitchen equipment. Group 1, our largest perishables stores, dedicate nearly one-third of their space (31%) to these non-retail support functions. At the other end of the spectrum, supplement-focused stores need just about half that space (16%) for their back rooms. (See Figure 7.)
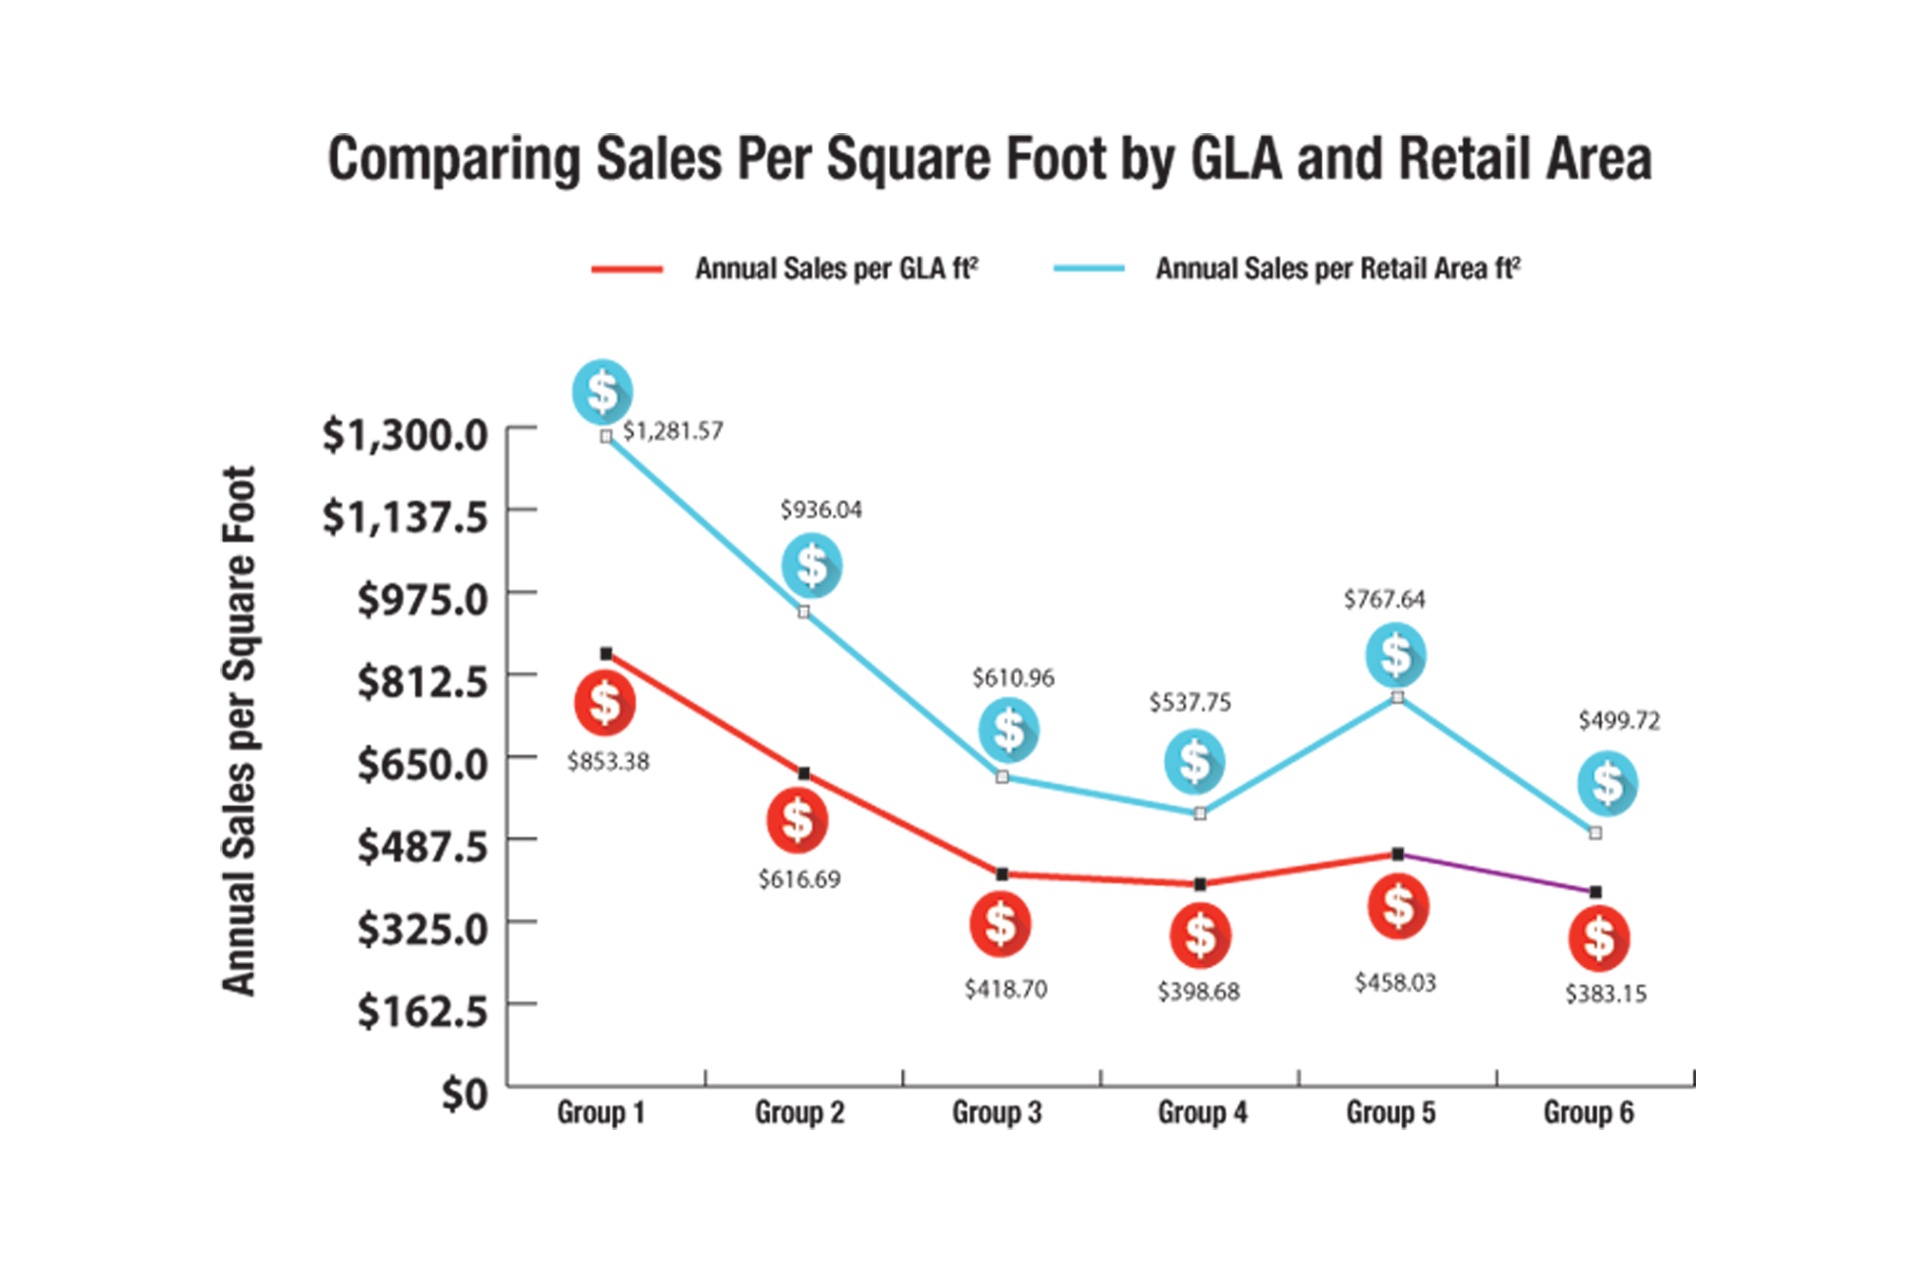
Average Annual Sales Per Square Foot We report sales-per-square foot for the total store (Gross Lease Area, or GLA), as well as for the retail-selling area alone, which excludes the non-retail back-room support areas. This year, annual sales per gross-lease-area (GLA) square foot averaged $447.57 overall for total respondents. At the high end, Group 1 came in at $853.38 in annual sales per GLA; Group 6 was $383.15.
When we measure sales against the retail area only, the overall annual average rises to $624.48. Retailers in Group 1 top out at $1,281.57 and the smaller, supplement-focused stores that make up Group 6 came in just shy of $500. (See Figure 8.)
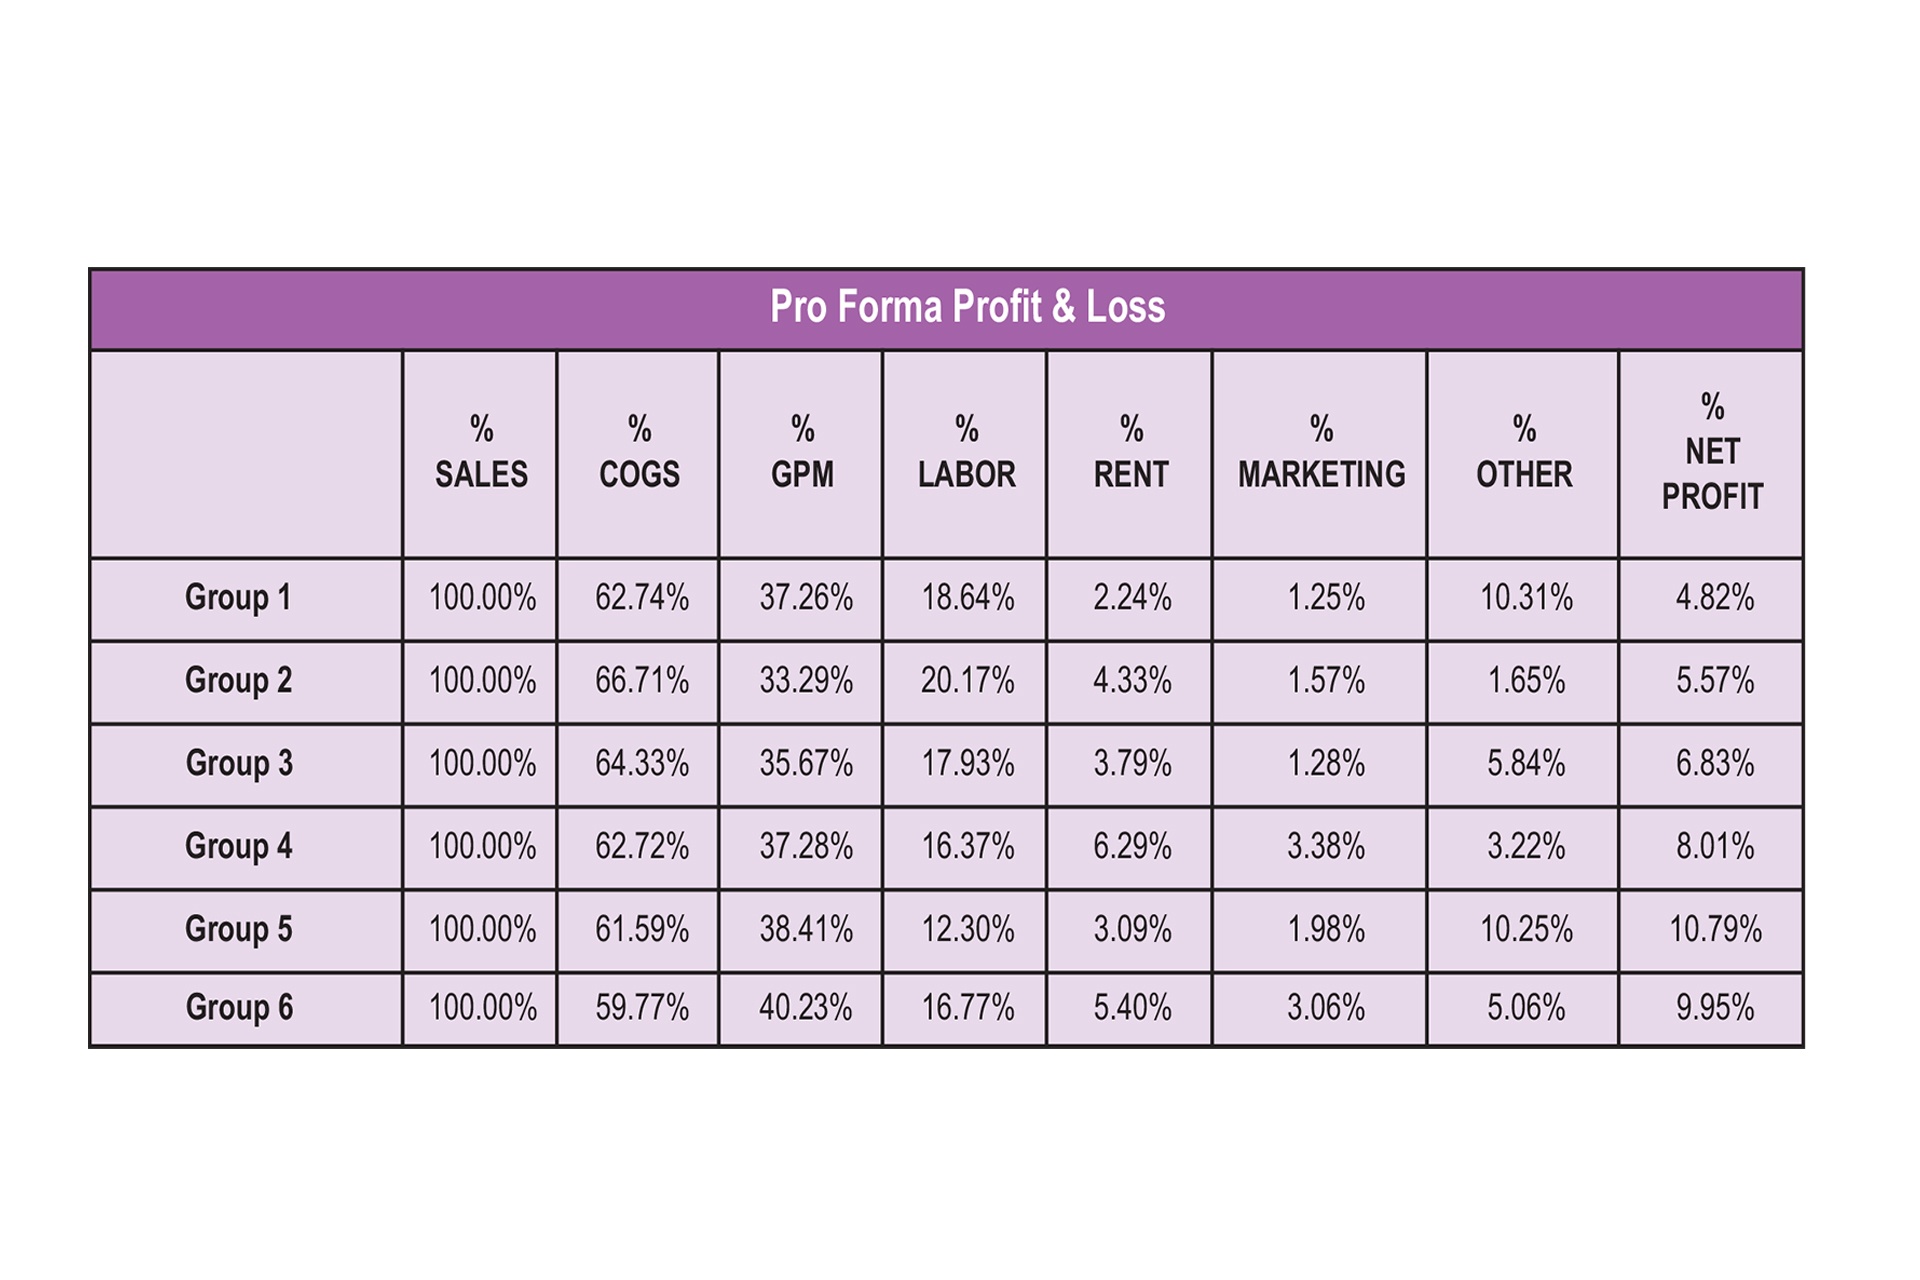
Costs of Goods and Gross Profit Margin We asked the independent retailers in our survey to tell us about their annual cost of goods (COGS) and gross profit margin (GPM). COGS ranges from a low of 59.77% in the supplement-focused stores that make up Group 6 to a high of 66.71% in Group 2. While stores in Groups 1 and 2 are both heavily weighted towards fresh foods, at 58.0% and 37.6% perishables sales, respectively, Group 1 appears to have significantly greater wholesale purchasing power, pushing COGS down to 62.74%—that’s nearly four percentage points better than the 66.71% COGS in Group 2. These findings are similar to what was seen in last year’s survey, with Group 2 reporting the highest COGS and lowest GPM. (See Figure 9.)
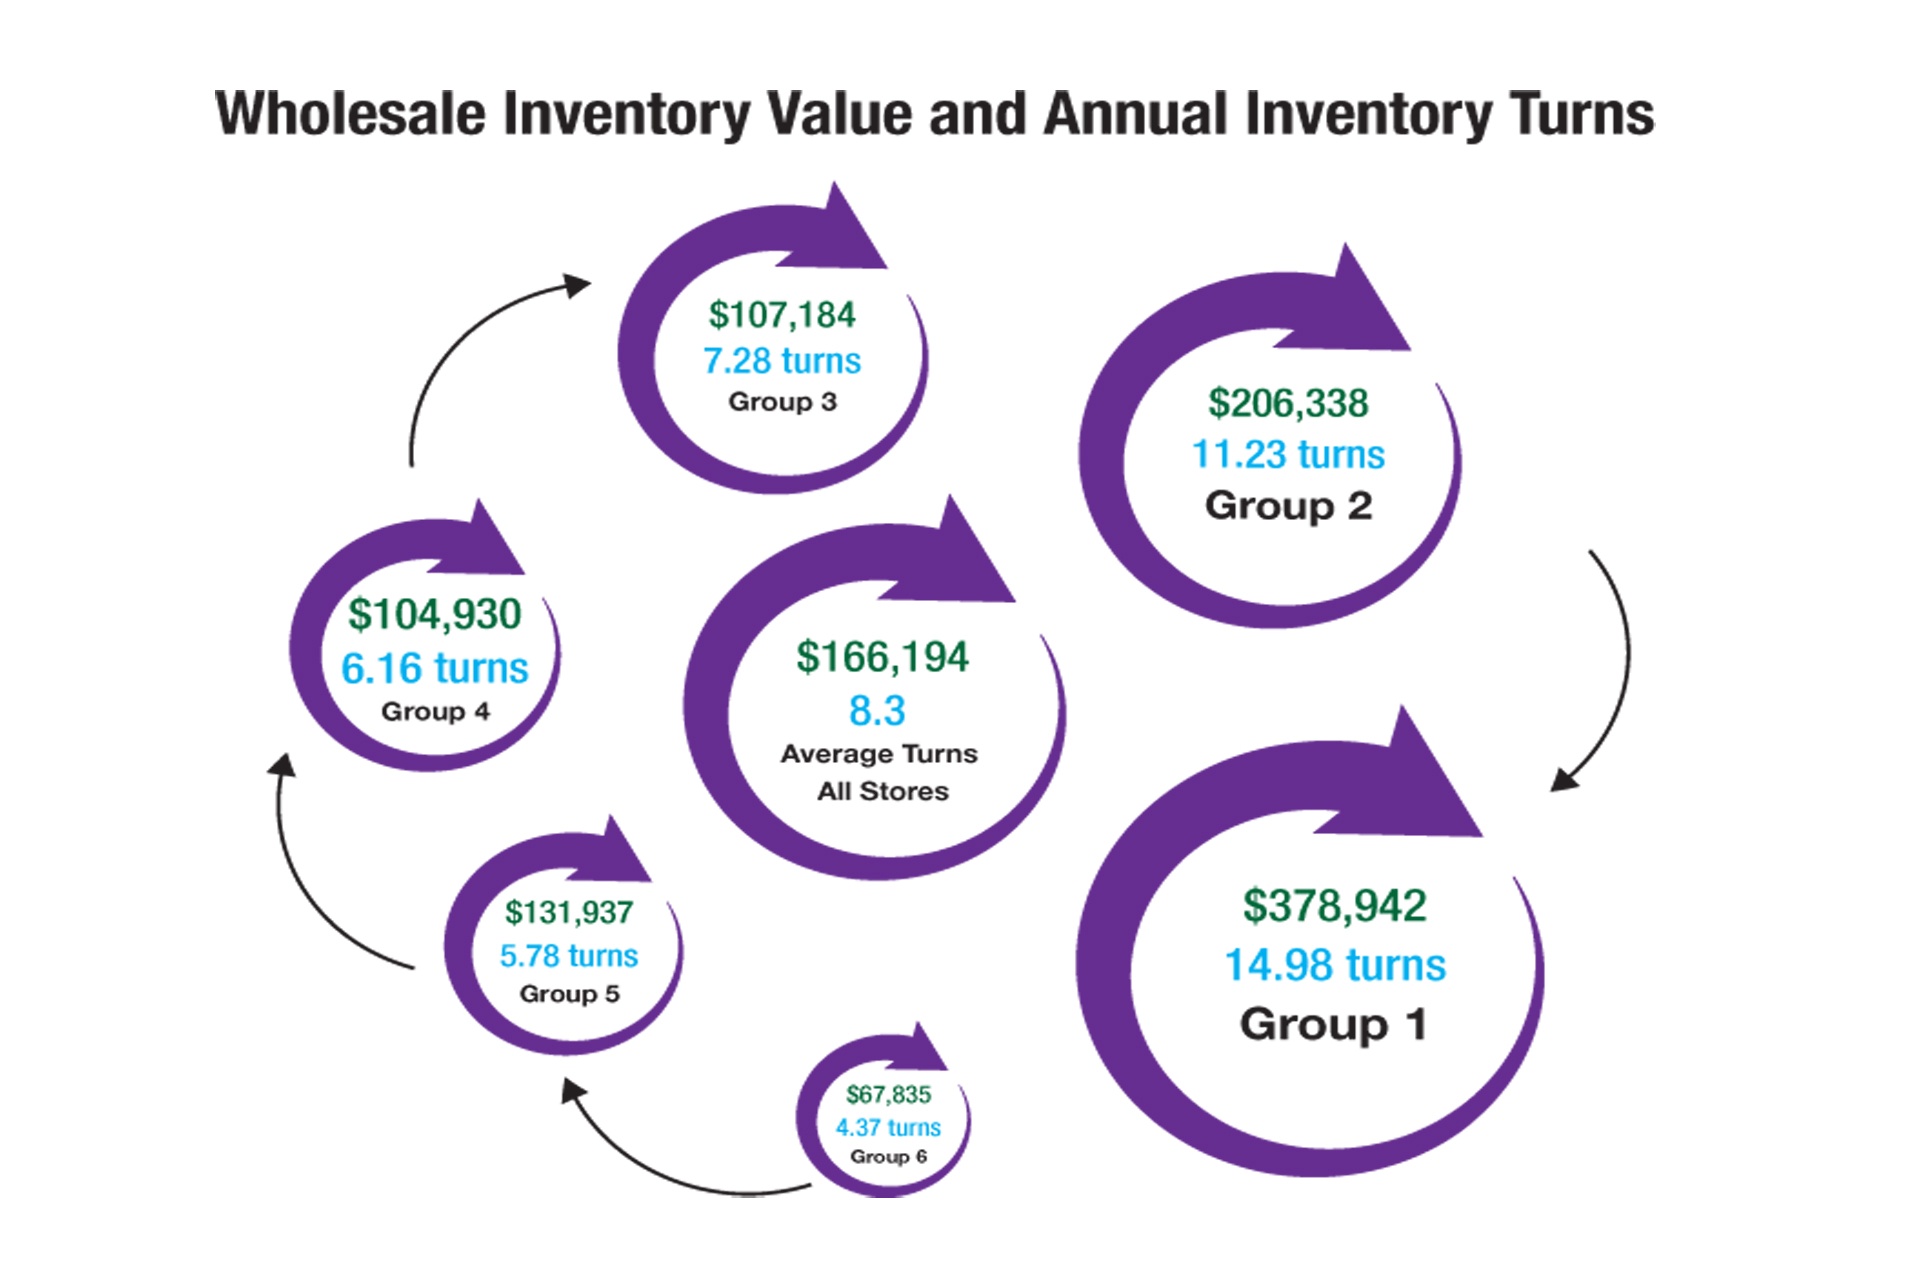
Inventory Value & Inventory Turns Wholesale inventory values rise along with the percentage of sales from perishables. In this year’s survey, numbers ranged from a low of $67,835 for Group 6 to a high of $378,942 for Group 1. Likewise, annual inventory turns increase as the percentage of sales from fresh perishables foods increases. Stores in Group 6, which sell supplements and personal care products almost exclusively, turn their inventories 4.37 times per year; or just over once a quarter—so about every three months. Stores in Group 1, with 58.0% perishables sales, reach 14.98 inventory turns per year—that’s just over once every three weeks, or 24 days. (See Figure 10.)
Investing in Employees Stores in Group 1, which sell the most perishables (58.0%), pay more dollars per hour for labor than groups selling fewer perishables. This makes sense, since the safety and efficiency required to prepare, butcher, cook and serve fresh foods demands more highly paid culinary talent. Still, Group 2 has the highest labor costs on a percentage basis, at 20.17%. What this suggests: Stores in this group don’t offer quite enough fresh foods to attract the daily traffic that would drive sales higher.
In supplement-focused stores, Group 5 appears to be investing in trained nutrition staff, paying an average of $16.56 per hour. The strategy seems to be working, as Group 5 generates nearly 2.5 times the sales of Group 6 ($1.23 million for Group 2 vs. $495,000 for Group 6), which pays $12.54 per hour on average. (See Figure 11.)
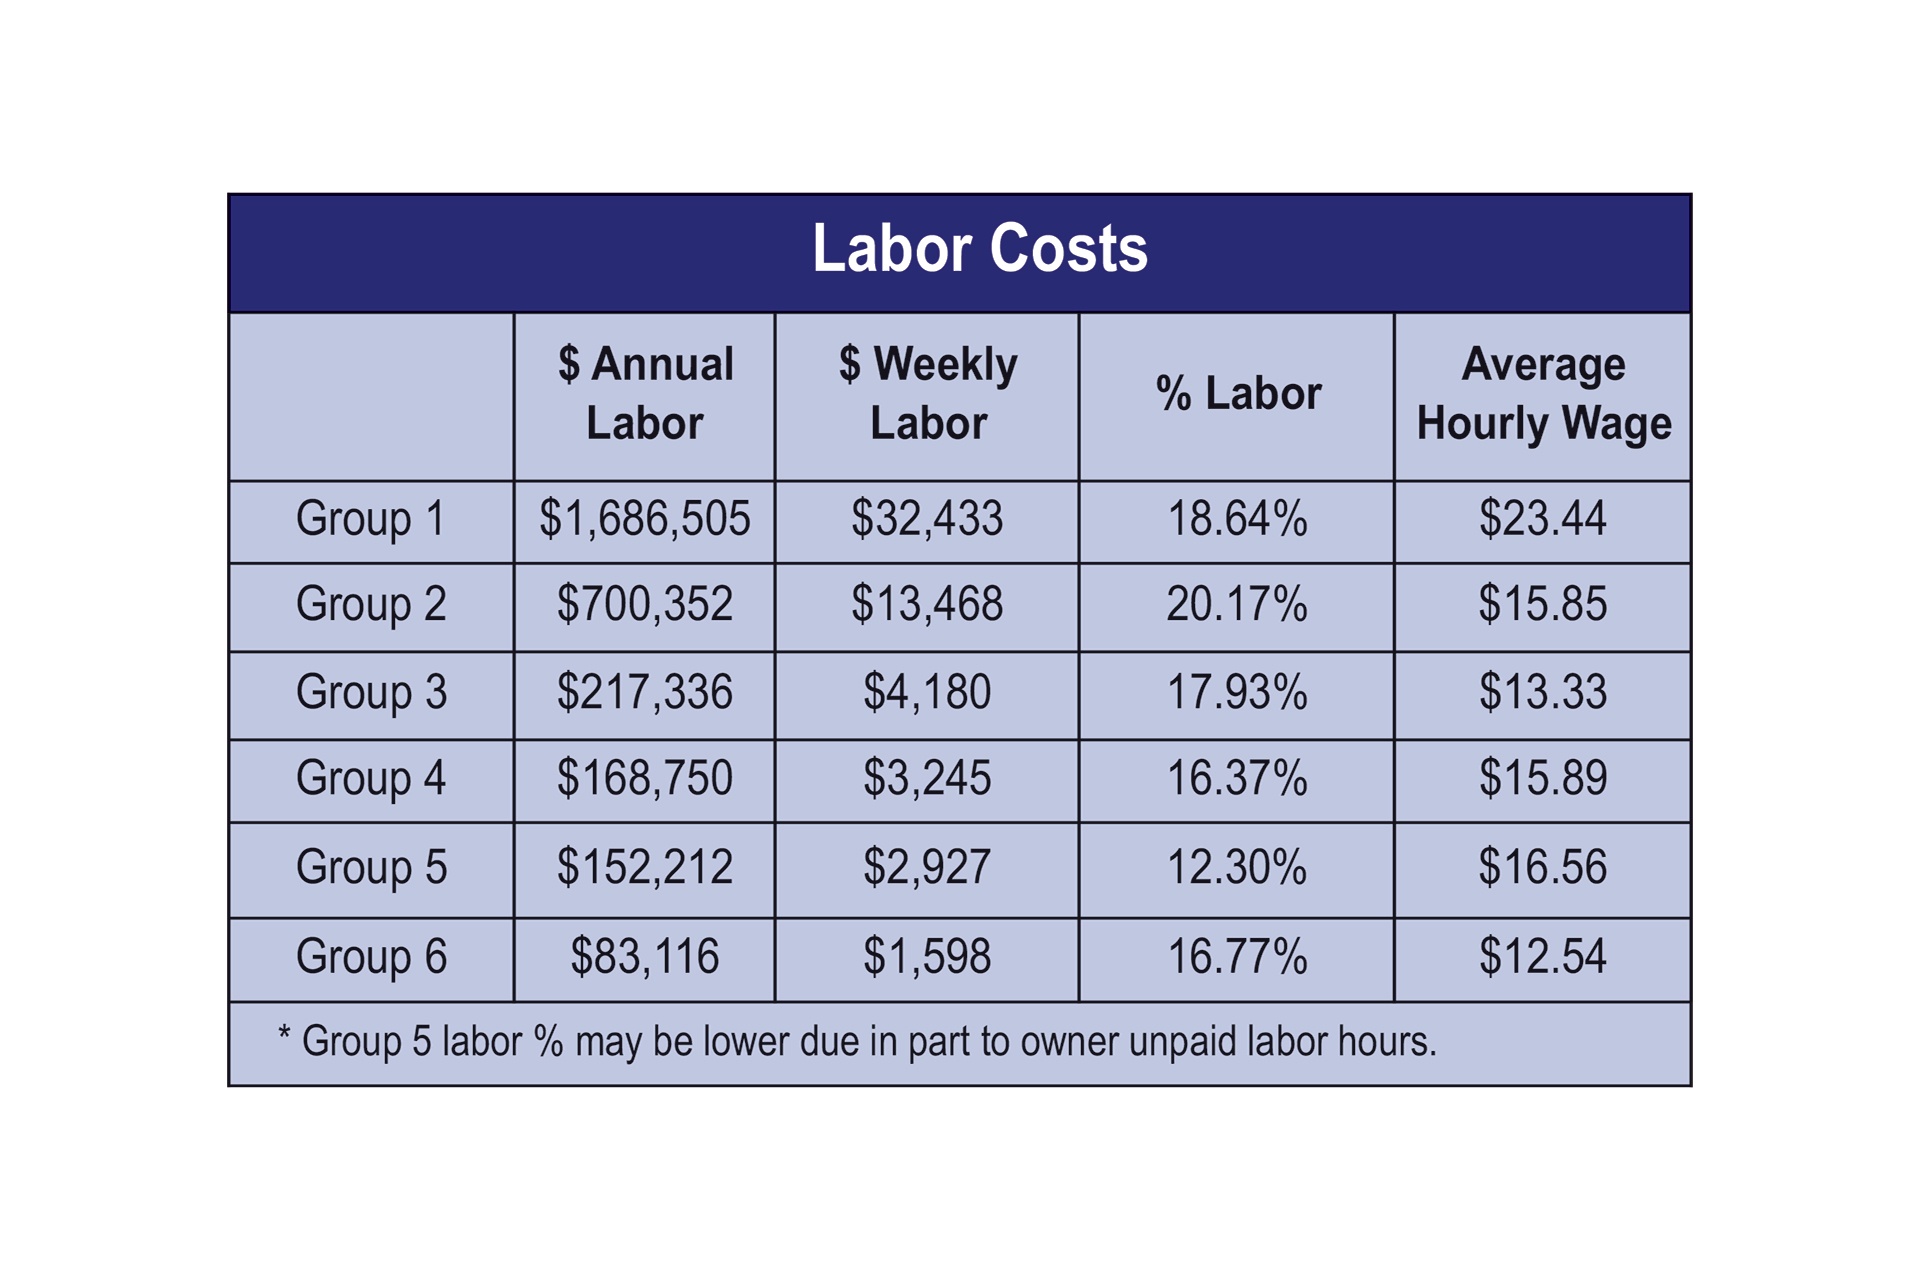
Compared to the results of the 2018 Survey, employees are doing well. Last year, stores in Group 1 paid employees an average hourly wage of $16.21—this year, that number is up to $23.44. The large jump in hourly pay may be the result this year of Group 1 consisting of only the most serious fresh-food stores, with a minimum of 46% perishables, compared to stores in Group 2 that can sell as few as 30% perishables.
Overall, full-time (35 hours per week) employees make up about 60% of all hours, with part-timers (clocking 20 hours per week) making up about 40% of hours. In one of the unique findings in WholeFoods Annual Retailer Survey, we measure how many employees it takes per 1,000 square feet to run a natural products store. Stores with fewer fresh perishables and more vitamins, supplements and personal care sales—that’s Groups 4, 5 and 6—generally take two to three full-time-equivalent employees (FTEs; 35 hours per week) per 1,000 square feet. Stores with more perishables sales require about four to five FTEs per 1,000 square feet.
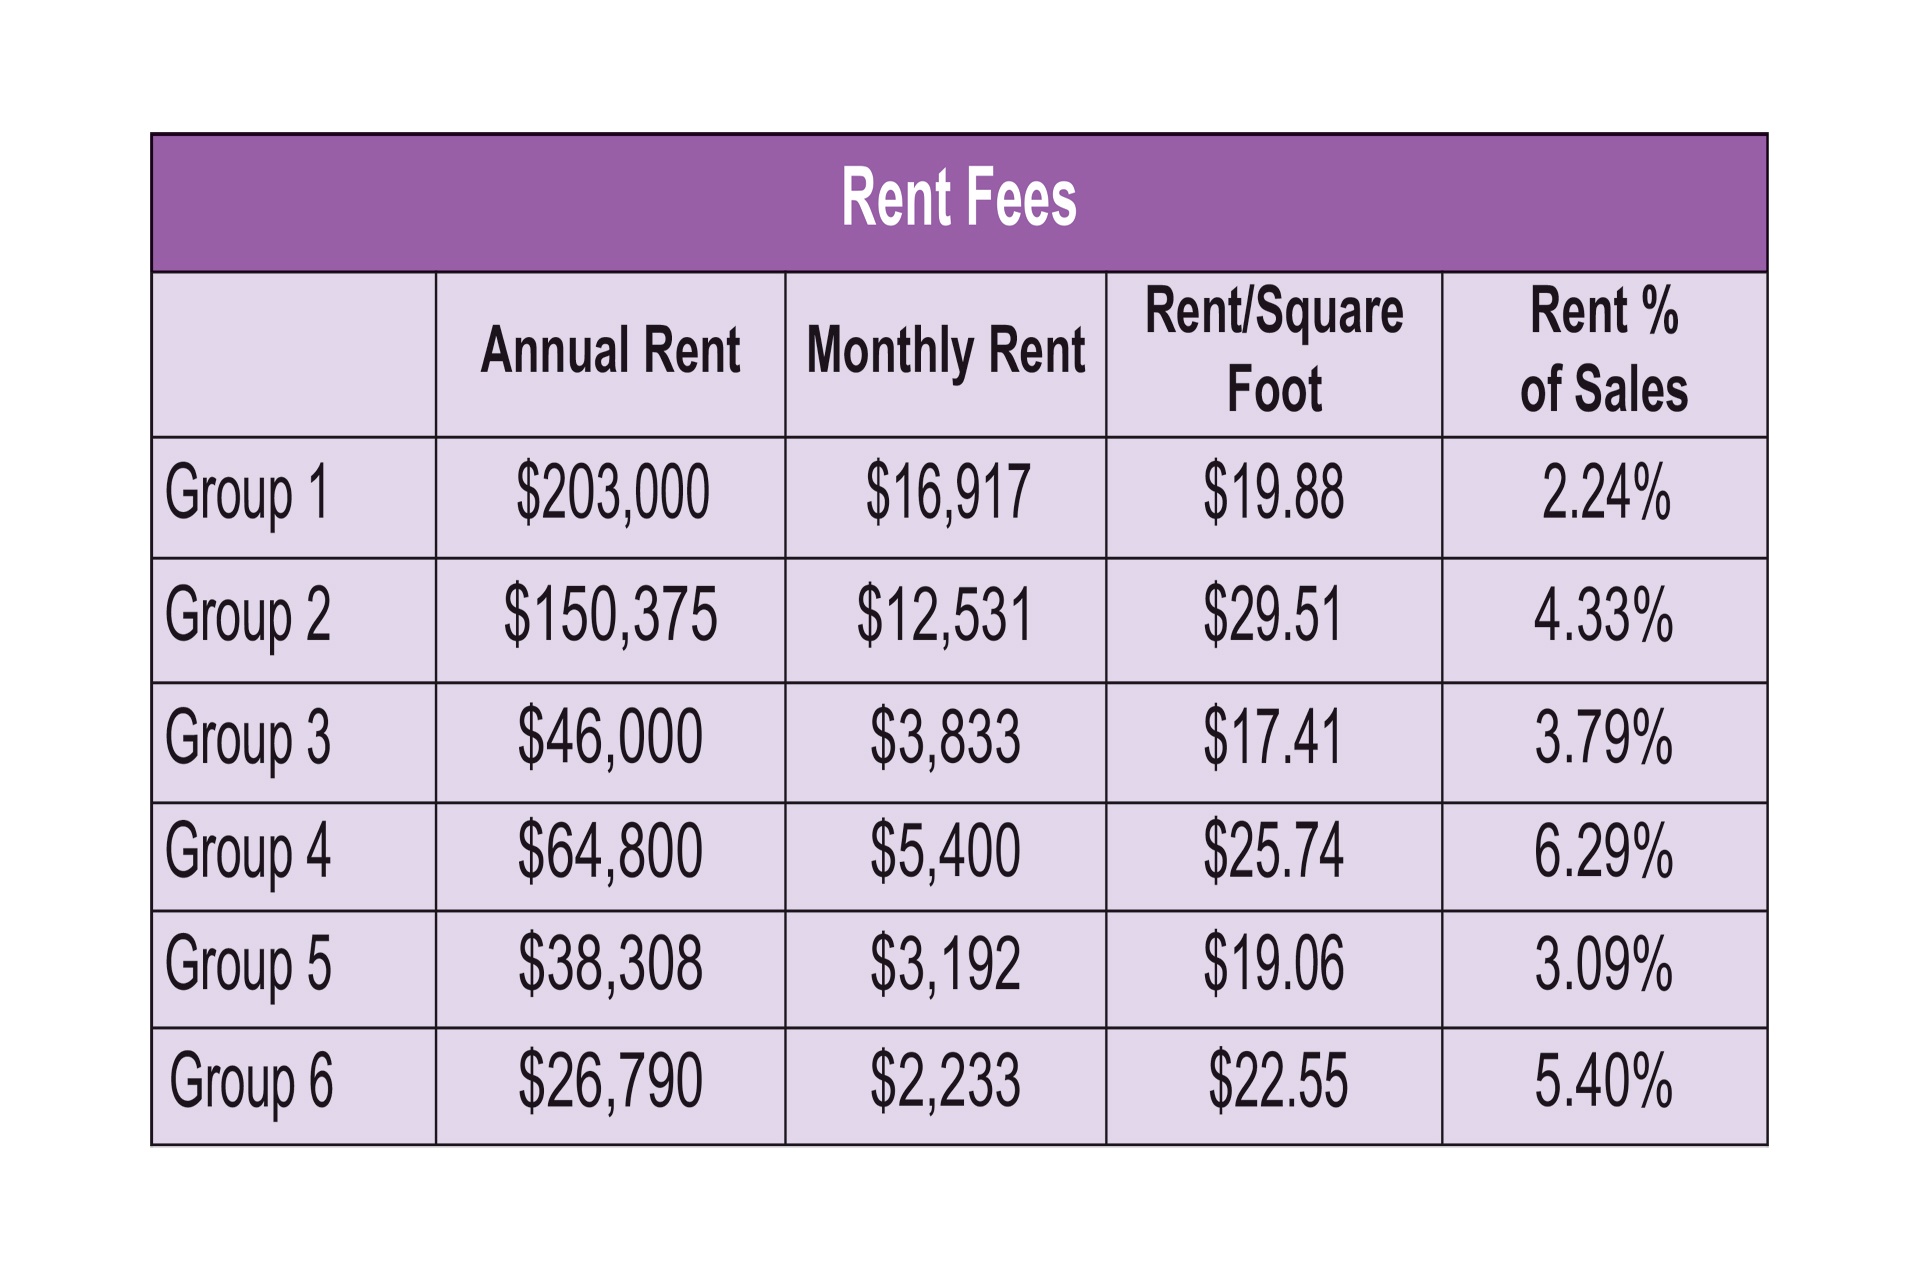
Paying the Rent The majority of respondents in this year’s survey, as in years’ past, are renters. They have been operating for an average of 31 years, and 24 years under current ownership. This helps explain why rents as a percentage of sales are in the low- to mid-single digits. Newer stores almost certainly would expect to pay a higher percentage in rent, especially in the early years of operations when sales are lower. Stores in Group 1, our largest and highest-perishables stores, appear to enjoy favorable “anchor tenant” lease rates (2.24% of sales), as landlords of these 10,000-square-foot stores may extend discounted rents because these retailers attract daily foot traffic that helps benefit adjacent tenants. Group 4 spends the highest percentage of sales on rent, which comes in at nearly triple that of Group 1 (at 6.29%). (See Figures 9 & 12.)
Delivery, Pick-Up & E-commerce This year, because of the rapidly changing expectations customers have for how they buy and receive their groceries, we added several questions asking retailers to tell us how they are managing this emerging trend. A majority of respondents (66%) told us they deliver directly to customers themselves, use third parties to deliver products, or some combination of the two. One-third (34%) of respondents reported that they do not offer delivery. About one in five retailers (21%) allow customers to order from them online, and one-third (35%) offer in-store pick-up. Slightly more than half of all respondents (53%) don’t offer any online, pick-up, or delivery options. (See Figure 13.)
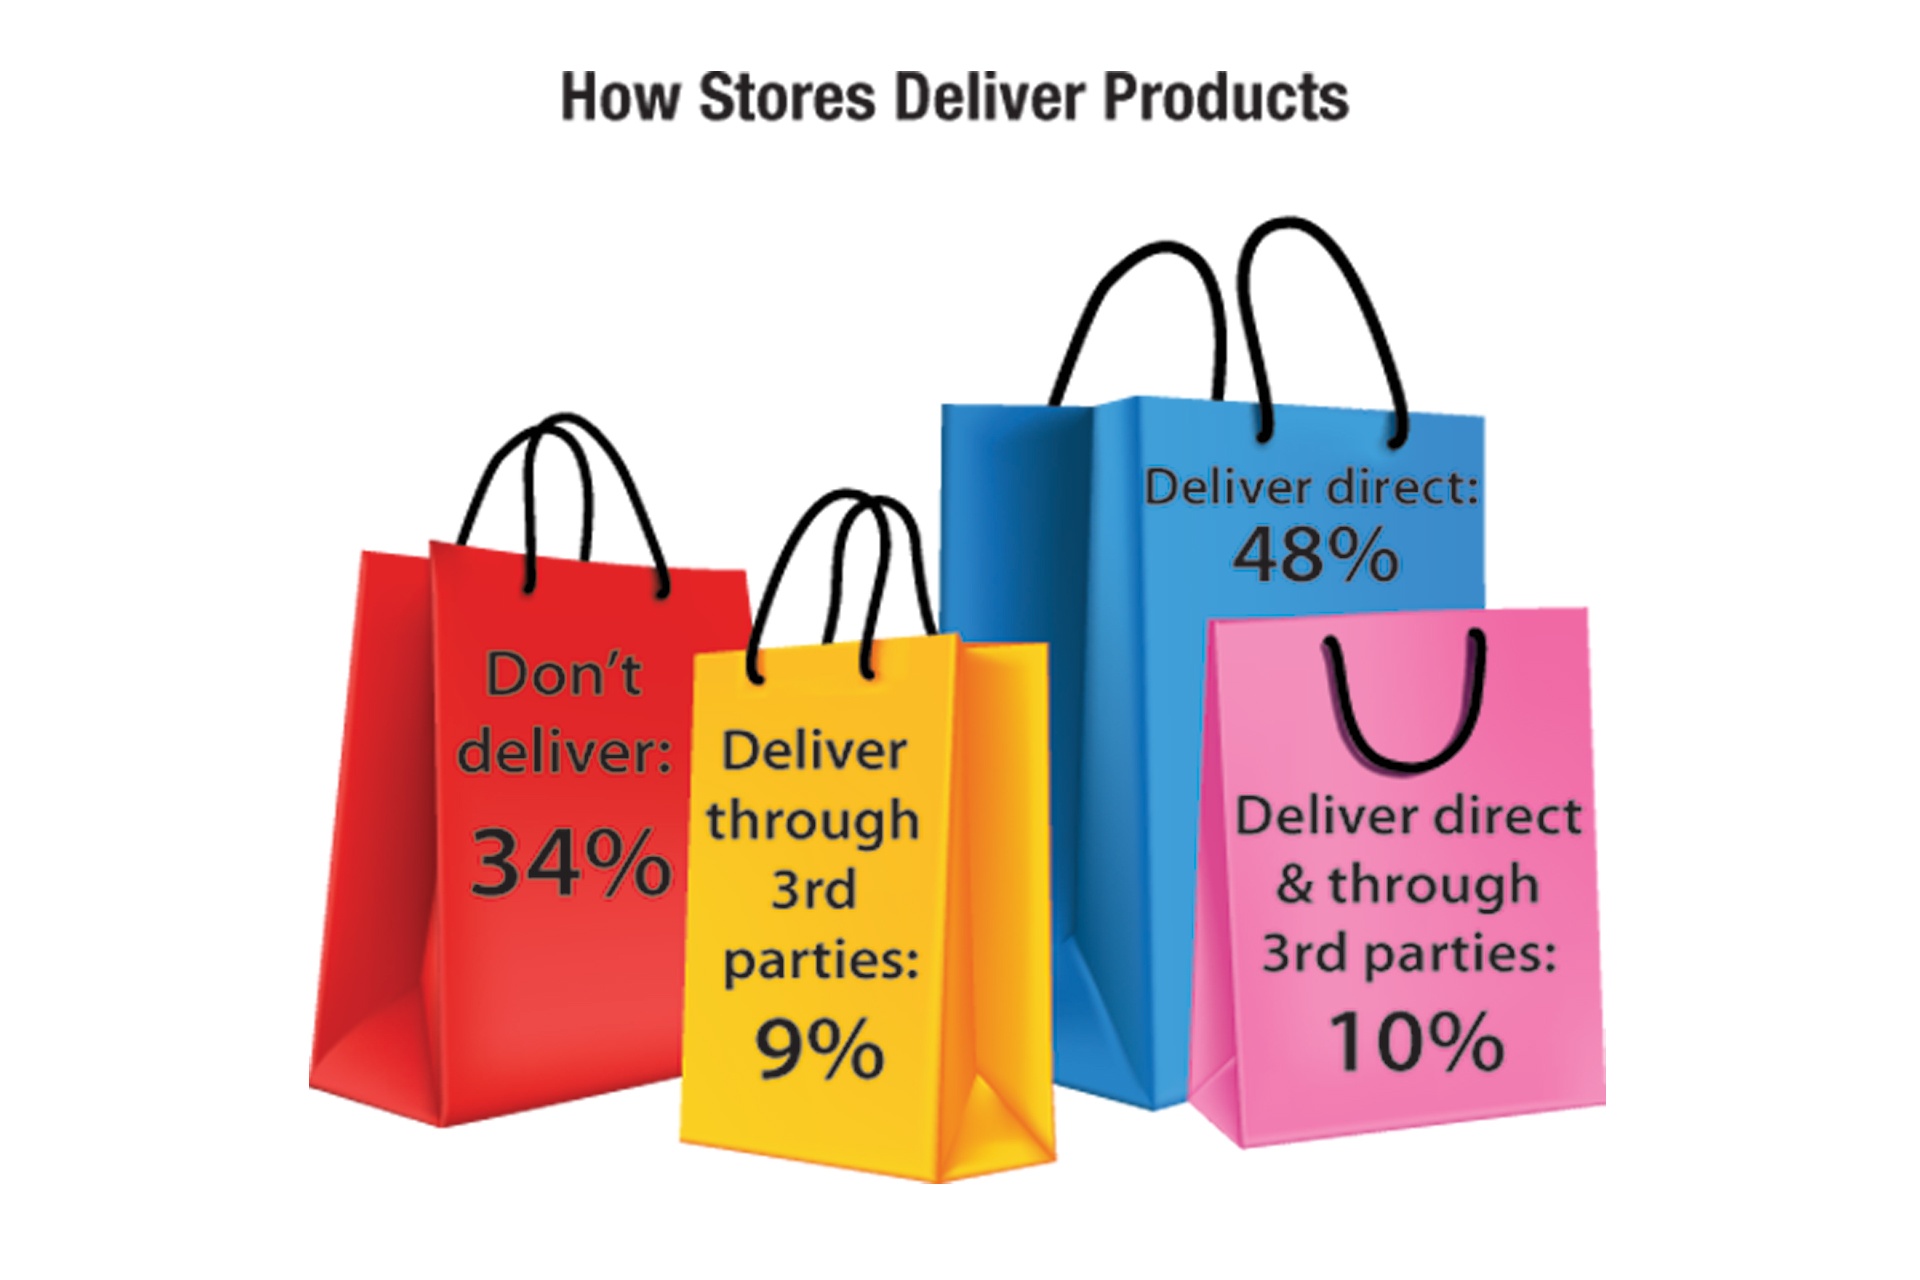
Of those retailers that do offer home delivery, 13% promoted their services during the survey period. Other promotions include online ordering (21%) and in-store pick-up (35%). Over half of stores (53%) didn’t offer any of these promotions.
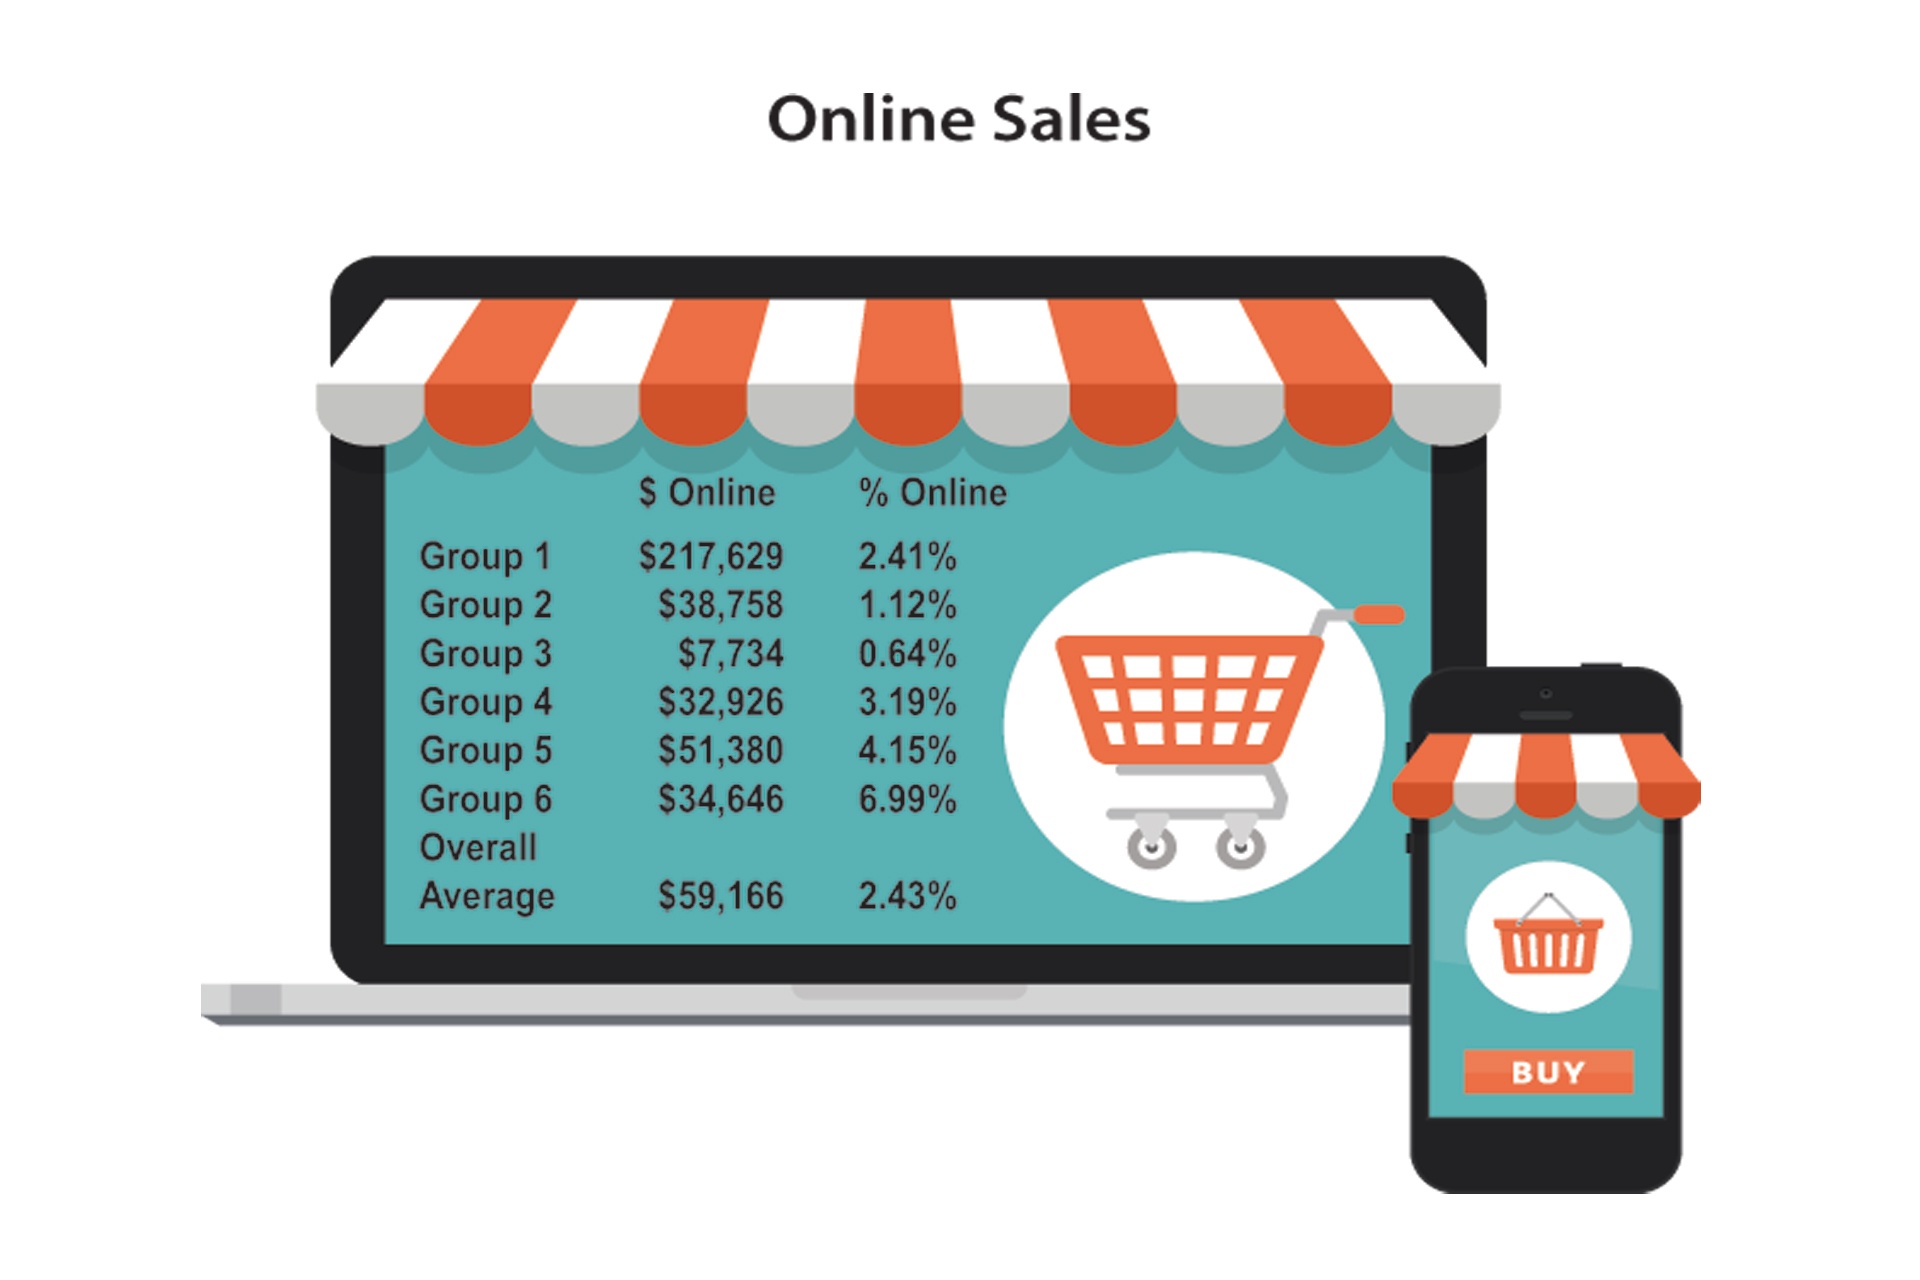
Natural products retailers are dabbling in online offerings, averaging $59,166, and 2.43% of sales. Online sales tend to increase as a percentage of sales in stores that sell more supplements, reaching 6.99% of sales for Group 6. Group 1 sells the most absolute dollars of any group online, averaging $217,629, which accounts for 2.41% of their sales. Group 3 isn’t doing much online, with online sales averaging under $8,000, which is less than 1% of sales. (Figure 14.)
Spreading the Word: Marketing and Merchandising Radio, social media, direct mail…retailers are investing in getting the word out about what their stores have to offer. All six groups in this year’s survey spent at least 1% of sales on marketing. Not surprisingly, it was the largest, high-perishables stores that spent the most dollars on marketing. Group 2 clocked in at $54,450 annually (1.57% of sales), and Group 1 spent more than double that, at $113,193 (1.25% of sales). Groups 3 spent $15,509 (1.28% of sales), while group 4 invested more, at $34,880 (this ranks as the highest percentage of sales of the six groups, at 3.38%). For the smallest stores, Group 5 shelled out $24,492 (1.98% of sales) and Group 6 focused a bit more on marketing, spending $15,162, which was 3.06% of sales.
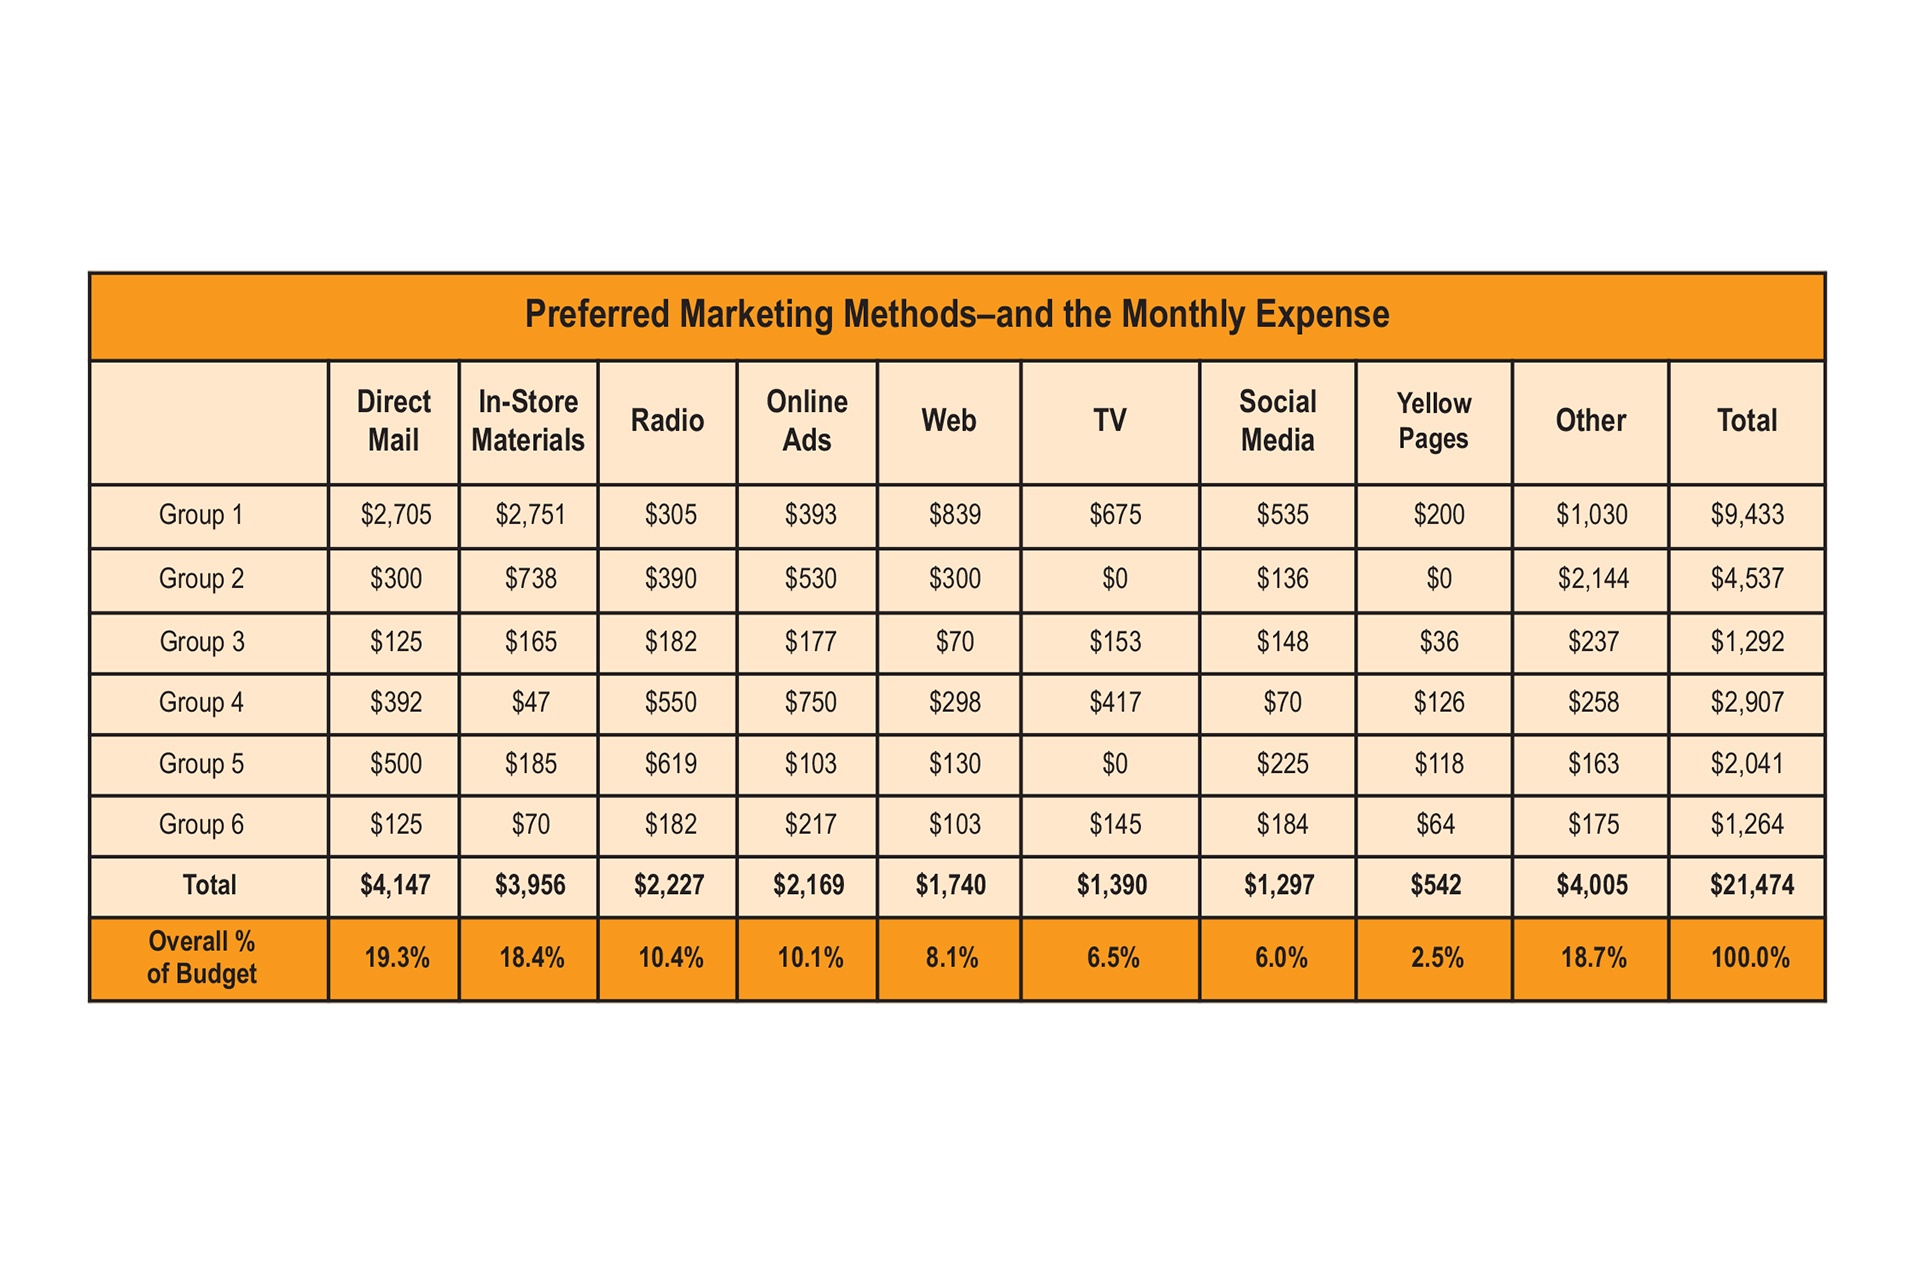
So how are those marketing dollars being spent? Retailers in this year’s survey are participating in the digital age, with marketing spending on websites, online advertising and social media combining to reach nearly a quarter (24.2%) of marketing spending. However, the single most popular marketing method was—wait for it—direct mail, which came in at 19.3%. Retailers appear to be taking advantage of the relative certainty that a direct mail message will reach its recipient, as well as the now-less-crowded marketing environment IRL (in the real world) compared to the noisy, massive online space. And yes, the trusty Yellow Pages are still a resource…for everyone except Group 2, that is, which seems to have chosen not to “let your fingers do the walking.” (See Figure 15.)
When it comes to merchandising efforts, the independent retailers who responded on this topic report that the most popular method this year, just as it was last year, is in-store product samplings and demonstrations—nearly 8 in 10 (78.4%) stores are on board with this. Over two-thirds of stores (66.4%) have educational handouts, and social media/blogs are also common (64.5%). Roughly one-third of those who answered here participate in consumer lectures (36.7%), email newsletters (35.8%) and print newsletters that are available in the store (32.9%). An online database of nutritional information is provided by 15.8%, and a handful of respondents (13.9%) participate in other merchandising efforts. Only 5% reported that they pass on merchandising altogether.
Private Label About one in three retailers in the survey (29.5%) told us they carry private label supplements. The range of stock-keeping-units (SKUs) was 12 to 800, with stores offering a private label line averaging 114 SKUs.
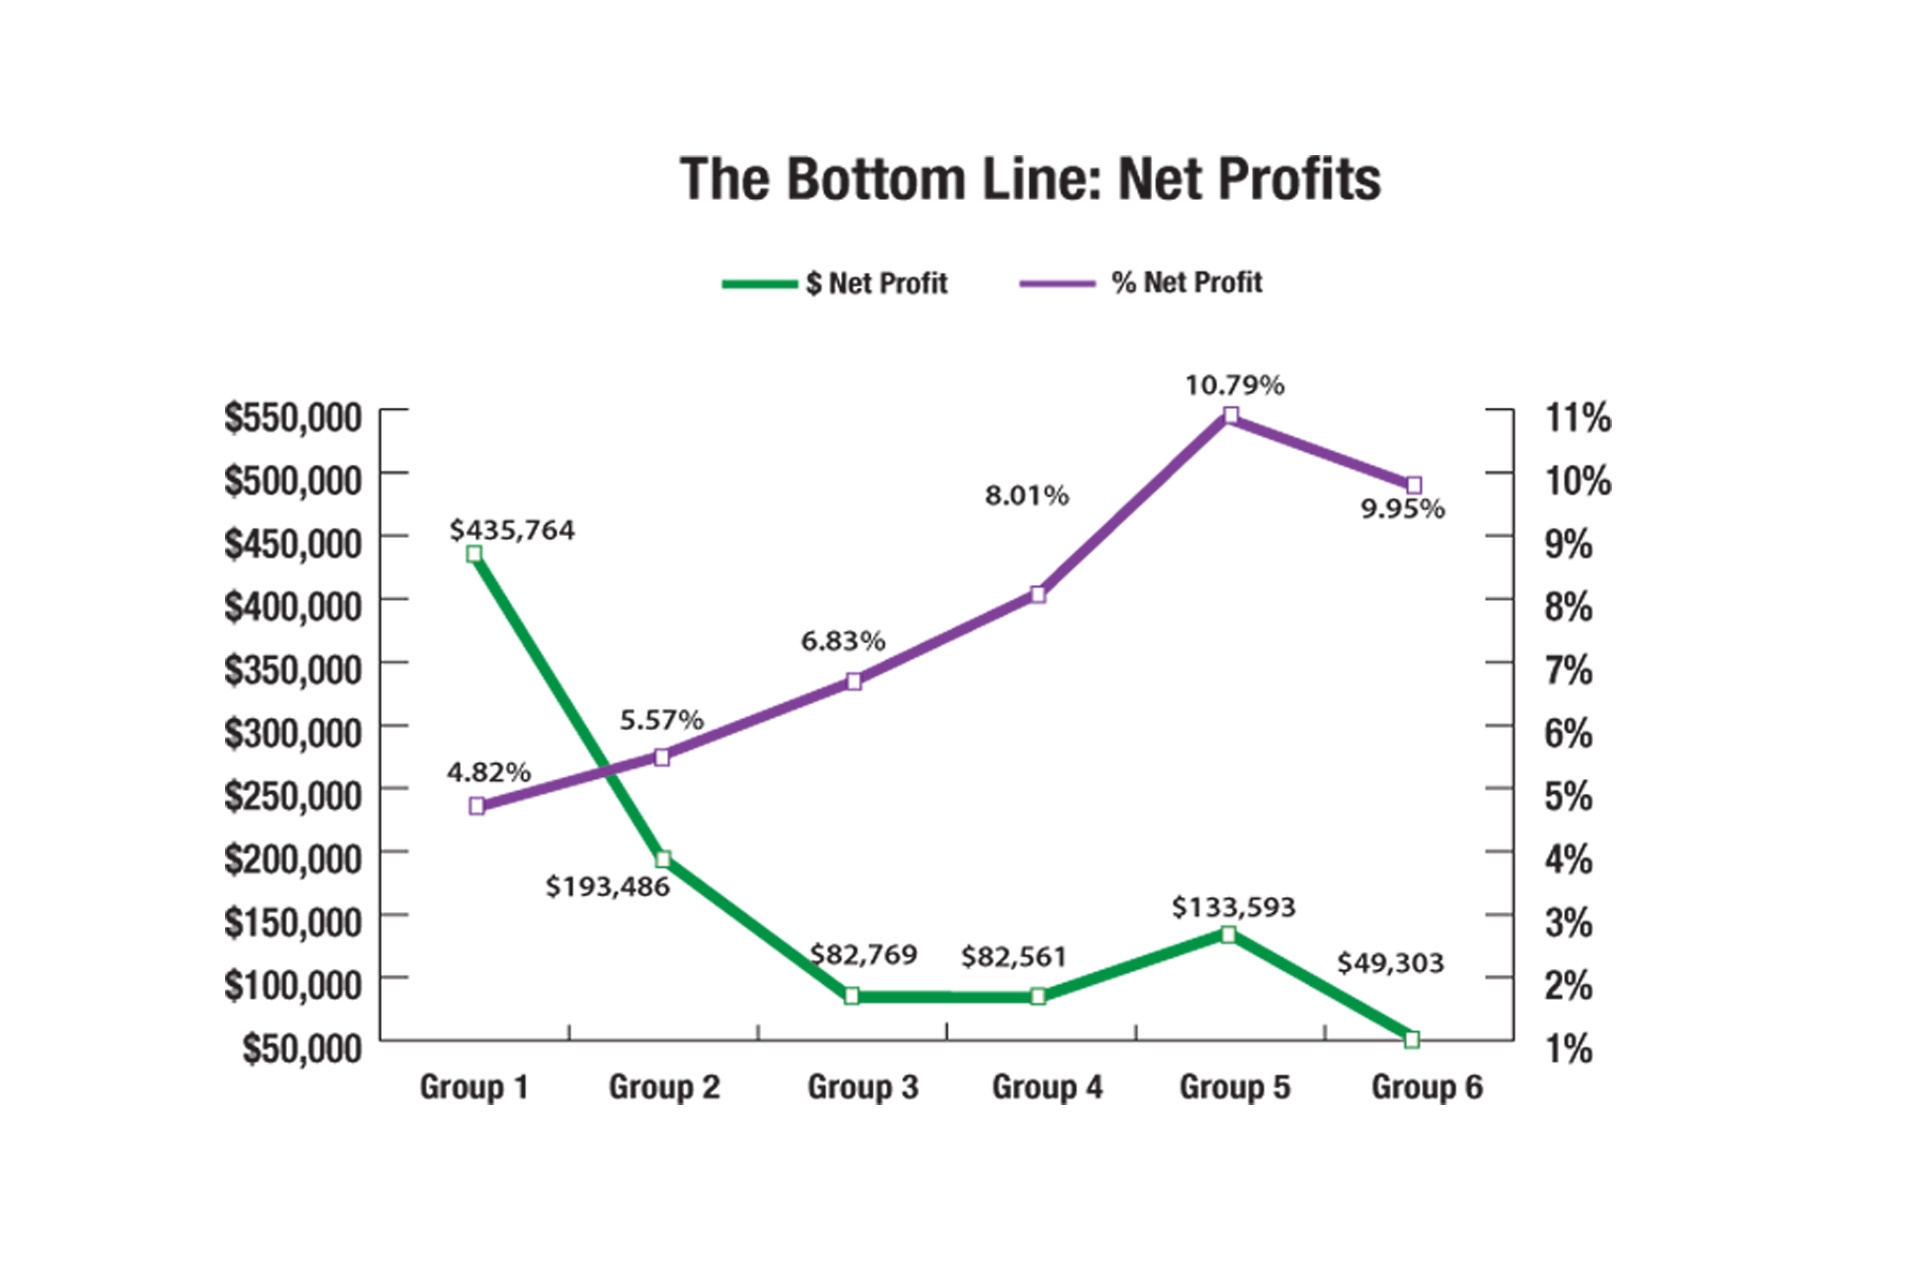
Bottom Line: Net Profits Overall, respondents in this year’s survey averaged net profits of $162,912. Net profits as a percentage of sales climb consecutively from group to group, starting at a low of 4.82% for Group 1 to a high of 10.79% for Group 5. Profit dollars are another matter, however, with Group 1 netting the most profit, at $435,764. Group 6 came in at $49,303—which works out to 9.95% of sales for these stores. (See Figure 16.)
Pro Forma Profit and Loss New for our 41st Annual Retailer Survey: We assembled pro forma Profit & Loss (P&L) statements for each of the six survey groups. Based on the detailed findings from this year’s survey, we can see the state of the independent natural products retailer universe is strong. (See Figure 9.)While each of the six groups reports good, to very good, gross and net profit margins, Group 2—our 5,000-square-foot stores with 37.6% of sales from perishables—appears to be the most vulnerable to an adverse event. While the other five groups each have at least 3% available to cover all other store expenses besides labor, rent and marketing, Group 2 has just 1.65% available. As we scan Group 2’s pro forma P&L, we can begin to see why. Group 2 gross profit margins, at 33.29%, are the weakest of all six groups, and labor, at 20.17%, is the most expensive. Perhaps Group 2’s smaller size compared to Group 1, averaging 5,096 square feet vs. 10,212 square feet, is not quite large enough to allow the perishables departments enough room to operate efficiently, making labor less efficient. And, at a little more than one-third the sales of Group 1 ($3.4 million vs. $9.0 million), stores in Group 2 may not have the wholesale buying power of their larger brethren in Group 1, which could be raising cost-of-goods, and depressing gross profit margins.
Still, Group 2 turned in good net profit performance, at 5.57%. This suggests that an adverse turn of events, such as increased competition, would first reduce net profits, before putting their business in major jeopardy.
Expansion and Remodels More than one in ten survey respondents (11.5%) expanded their stores this past year. Some were remodeling the whole store as the second generation took over from the founding generation, and other stores simply relocated to a new retail space. Expansions ranged from 50 square feet to more than 10,000 square feet, with retailers spending as little as $100 per square foot to more than $800 per square foot. As one might expect, the most expensive expansions involved kitchens, which often require commercial grade stoves and ovens, fire suppression systems, and stainless-steel work surfaces.
The most popular expansion department overall was vitamins and supplements, but only in Groups 3 through 6. Our largest food-oriented stores in Groups 1 and 2 did not expand supplements last year. Stores in Group 1, however, did expand in their already prominent prepared foods departments, as well as in frozen and refrigerated sections.
The most aggressive group in expansions: Group 3—those stores with 25.5% perishables sales. These stores expanded across all perishables and non-perishables departments last year, including fresh meat and cheese departments, as well as all non-food areas, adding space for practitioners and for weight training equipment.
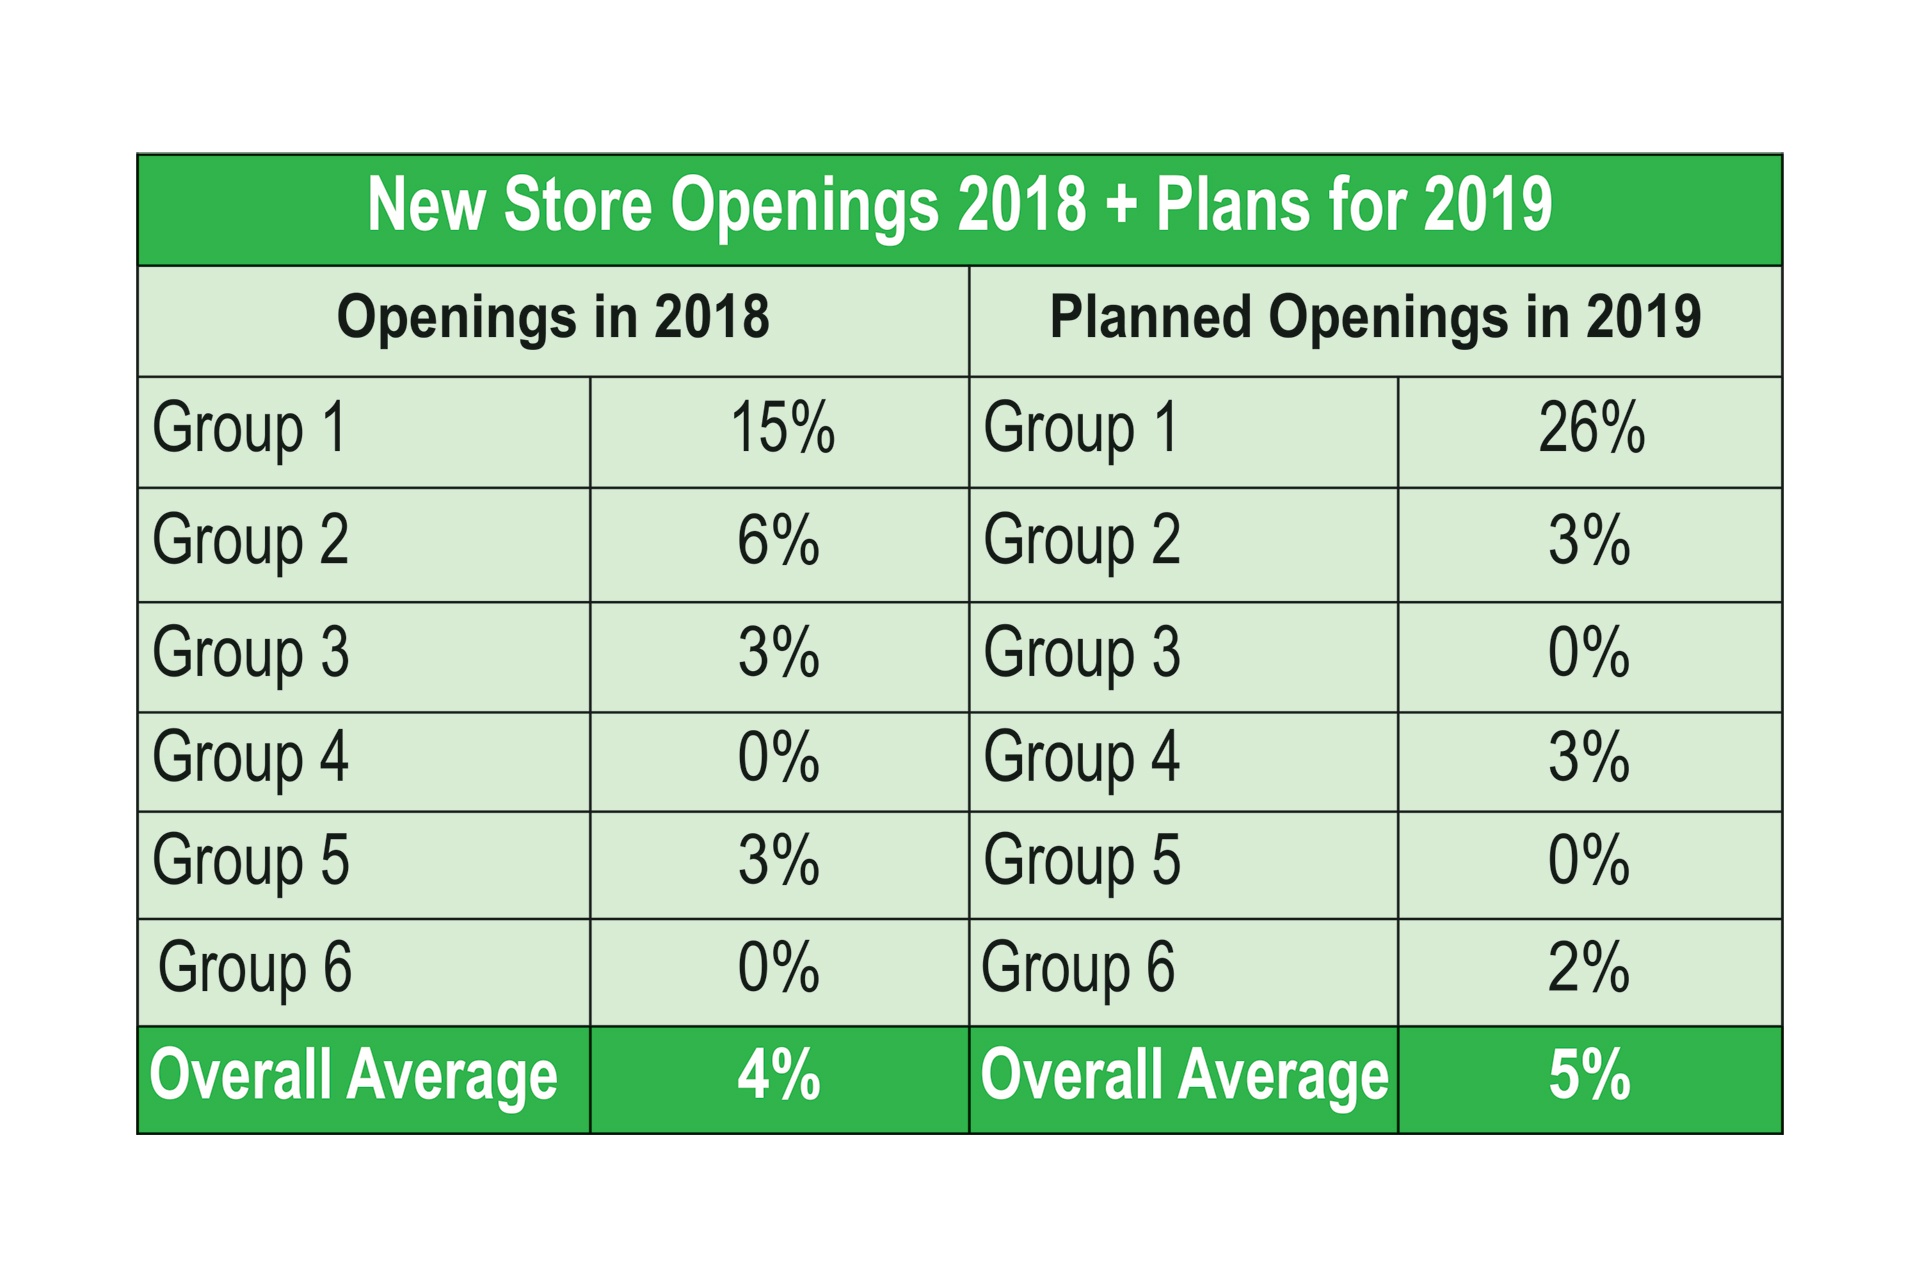
Overall, 4% of respondents opened new stores this past year. In addition, several also relocated existing stores. Clearly, fresh-foods-focused stores were the most bullish, with 15% of stores in Group 1 opening new units, as were 6% of stores in Group 2. Three percent of stores in Groups 3 and 5 opened new units, while none did in Groups 4 and 6.The Future Looks Bright An overwhelming 92% of respondents who forecast their sales for this year (2019) expect an average increase of 4.8%. Just 8% of respondents who gave us their forecast believe sales will decline, by an average of 3.9%.
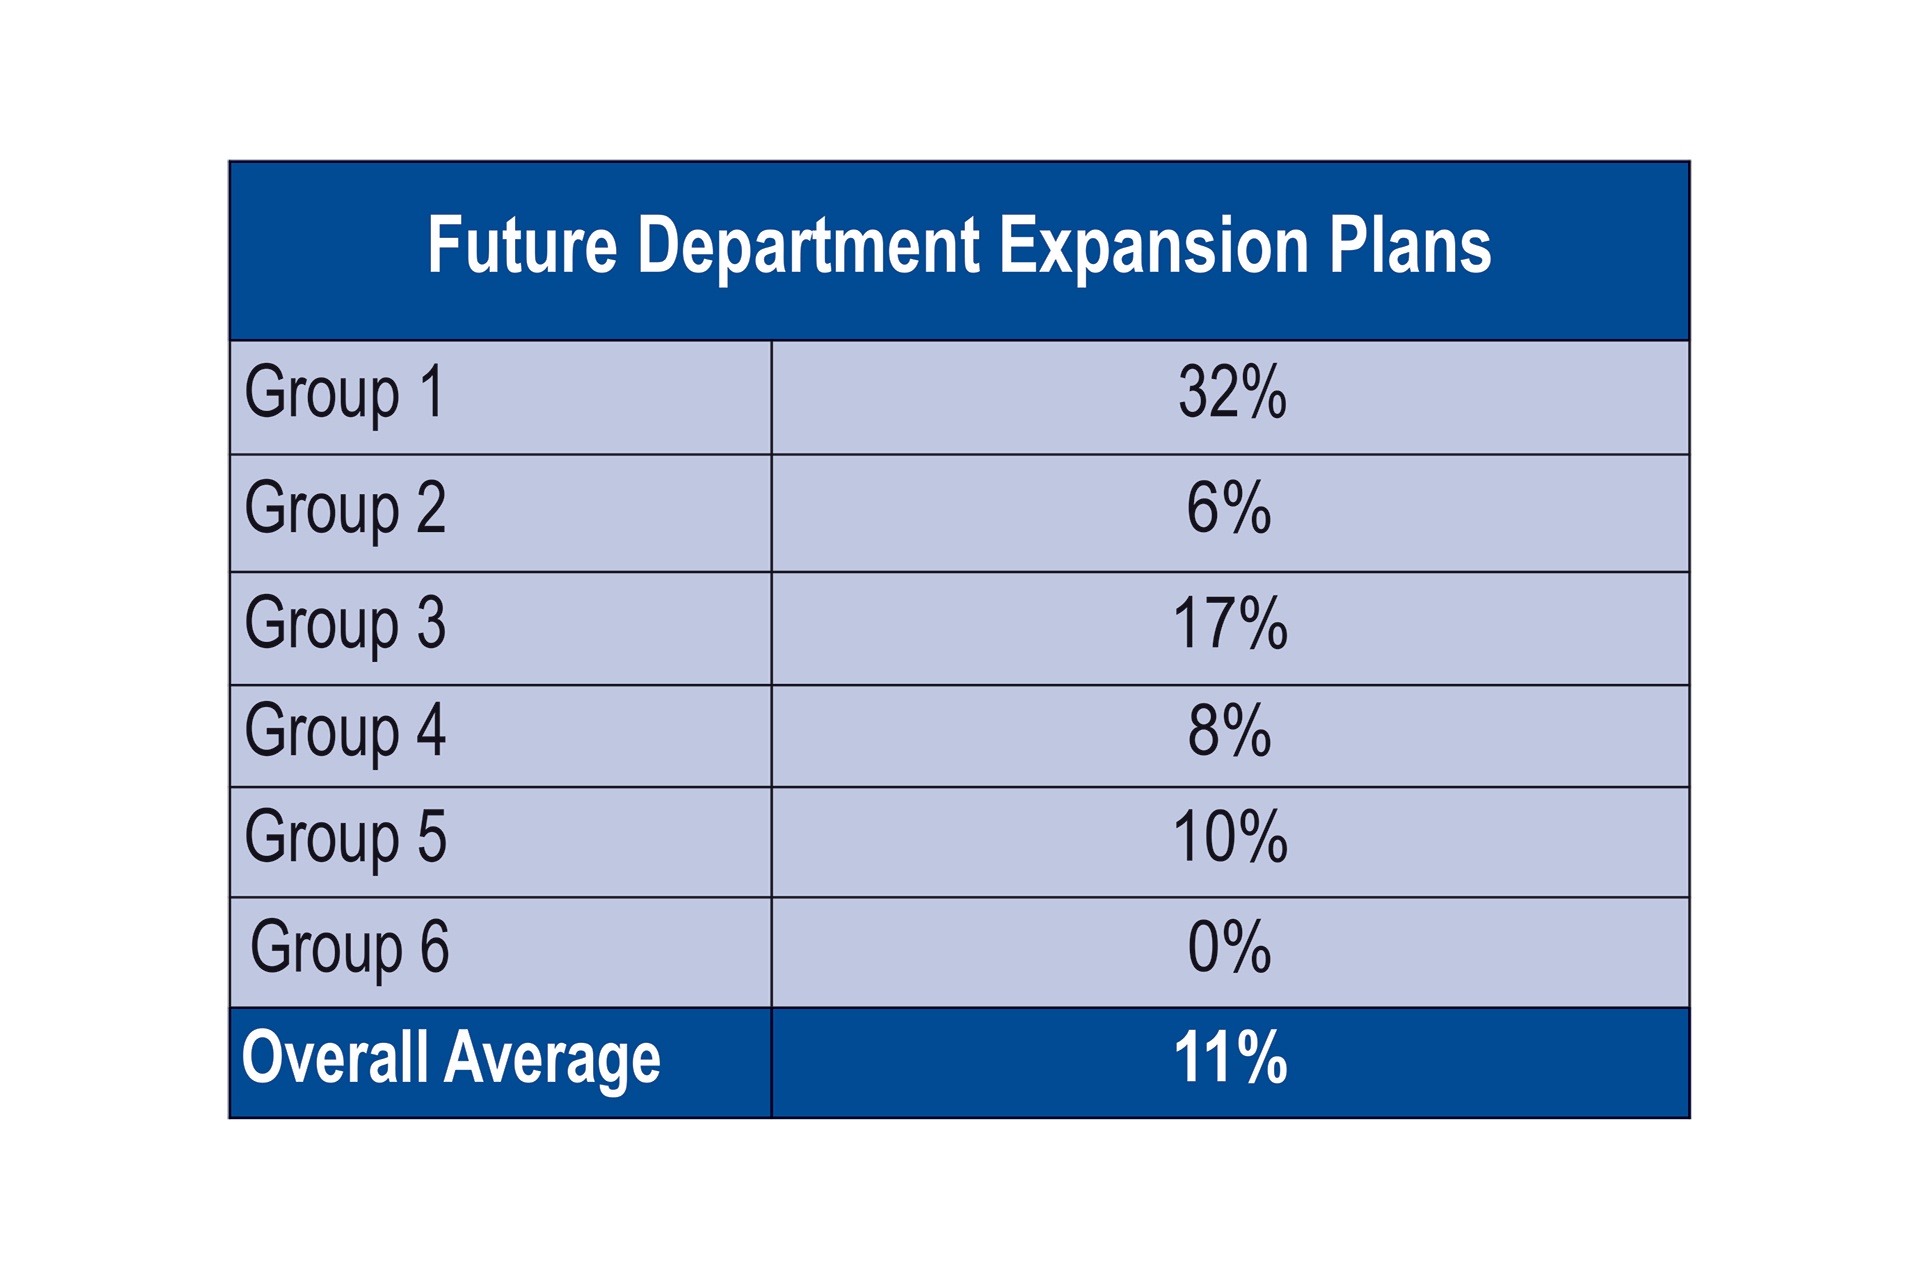
Retailers also responded enthusiastically about their plans for expanding departments this coming year. Overall, 11% of respondents plan to expand departments this year—nearly the same percentage as last year, with the largest fresh-foods stores in Group 1 having the most aggressive expansion plans. Roughly one in three respondents (32%) in Group 1 plan department expansions. That’s followed by one in six (17%) of those in Group 3, 10% of stores in Group 5, 8% in Group 4, and 6% in Group 2. Those in Group 6, the smallest supplement-focused stores, don't plan to expand departments. (See Figure 17.)
Respondents told us they planned to add anywhere from 250 square feet to 6,500 square feet of department expansion space, with the average expansion about 4,000 square feet. Retailers estimated their expansion costs from less than $100 per square foot to more than $550 per square foot, with the average running just over $150 per square foot. By far, the most popular department for expansion this coming year is prepared foods, including juice bar, café, bakery and grab-and-go, followed by expansions in refrigerated and frozen departments. Group 1, our largest fresh-foods stores, will be most aggressive in expanding prepared foods departments, and will also be the most active in expanding frozen, refrigerated and fresh produce departments. As we saw with expansions last year, Group 3 plans to continue expanding in all departments this year. We believe retailers in Group 3, with 25.5% of total sales coming from perishables, feel the need to raise their fresh-foods game, and get perishables departments up to a critical mass of overall sales in order to attract more daily foot traffic.Overall, for the coming year, 5% of respondents have plans on the drawing board to open new stores, an increase over last year's 4%. Group 1 is most bullish, with more than one in four (26%) of respondents planning new units. Three percent of those in Groups 2 and 4 will add at least one new store, and 2% of retailers in Group 6, our smallest supplement-focused stores, are confident enough to add units. Retailers in Group 3 appear to be focused internally, expanding in all departments last year, and planning to expand in all departments this year, but do not have plans to add stores this year. (See Figure 18.)
 What is it about your business that you’d most like others to know? We asked our survey respondents to comment on any aspect of their businesses, from online sales to pressing concerns, to plans for the future. The concern that came up most often: Competition from online retailers and, you guessed it: Amazon. One respondent summed it up in a nutshell: “Amazon is ruining our industry!!!!!!!” Yes, 7 exclamation points to emphasize the concern, and this retailer wasn’t alone.
Echoing the Amazon concern: “Amazon has infiltrated all aspects of business and has made a major impact on the way customers purchase products.”
“Sales continue to drop at an alarming rate on all supplements. Store sales have continued to drop about 30% in the first 6 months of 2018. We blame internet sales growing at an exponential rate.”
Retailers are feeling the squeeze from other areas as well: “Ten years ago, we were the only store in the area. Besides Wegmans and Whole Foods, now there are seven. That does not even include the internet. People are less interested in service where they shop. Americans are…interested in convenience and speed to which they can accomplish items on their to do list. So long America. You made your bed now you have to sleep in it.”
“It is getting tougher and tougher for family owned independents to exist. Vendors are setting MSRPs that make for smaller margins, costs of labor due to mandatory ‘living-wage’ increases, taxes, overhead....it all adds up and it makes eeking a living out of a business more and more challenging.”
Some noted how they were responding to the competition: “Most pressing issue: competing with Amazon, et al. (i.e. online discounters). Future growth will depend on continued sales of CBD. When that’s gone because it has become rescheduled, every major retailer (Wal-Mart, 7-11, drugstores, etc.) will have it and the retail sale price will drop substantially, as will profits. First there was organic, then everybody had that. Then there was gluten free, now lots of stores have allergen free choices. When CBD is gone, the Next Big Thing is likely to be non-meat and non-dairy protein. Independent retailers are always searching for the Next Big Thing. It’s what keeps us ahead of mass market.”
“I am competing with online retailers. I plan to start selling my private label online in the next year.”
“Focusing on ours as a venue where those trained in holistic health can find a career outside of personal clients. Our type of venue depends on staff with a solid background in herbalism, nutrition (covered as an herbalist), social tact/counseling, and ecology, horticulture, chemistry and bodywork skills are good to have. Having ours seen as such a venue—more like what a pharmacy used to be—is important...Some stores do well with big, well-trafficked areas, but others are needed to service neighborhoods, tailored to the area’s individual needs.”
“Our store is unique in that we have been serving our area since 1926, currently owned by the founder’s great-grandson. We still purchase produce from local farmers, bodycare from local suppliers, make all of our deli soups, sandwiches, salads, bake all of our own baked goods, get in half hogs and steer and butcher on premises to customer specifications. We added the Natural & Organic department in 2006 and it continues to grow as customers demand.” WF