Thank you for participating in WholeFoods Magazine's 2026 48th Annual Retailer Survey. To show our gratitude, here is your advance look at key findings from the survey.
How to Use This Survey
If you are an independent natural products retailer, you can compare your results to stores in this survey that are most like yours by calculating your perishables as a percentage of total sales. That number will place you in one of the survey's five groups, ranging from about 1% perishables in Group 5 to at least 45% perishables in Group 1. By comparing your results to peers with similar perishables sales, you will reveal the results most relevant to you and your store.
Which group are you? Find out in 3 steps:
- Tally up your sales from the four main perishable fresh-foods departments: refrigerated, frozen, produce, and prepared foods.
- Calculate what percentage of your total sales these four categories represent.
- See figure 2 for the perishable foods percent range for each group. Compare your results to stores in your corresponding Group: 1, 2, 3, 4, or 5.
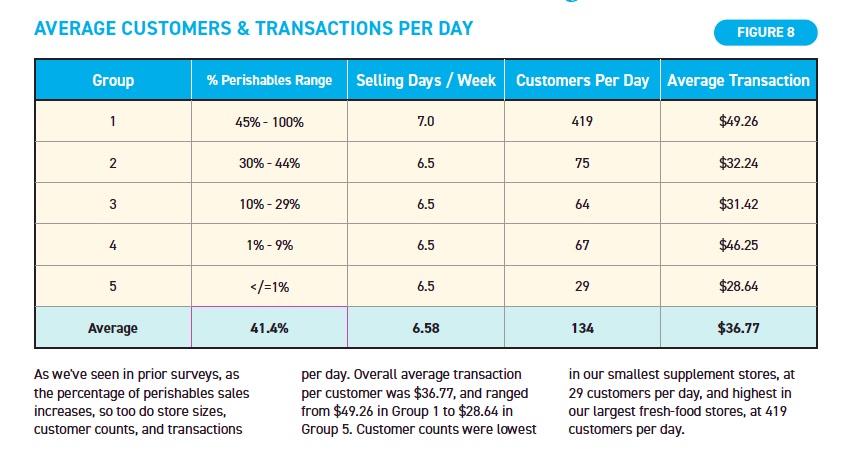
Average Customers & Sales Per Day