Many of us shoot for efficiency in our lives and in our businesses. It’s safe to say from the results of the 2014 WholeFoods Retailer Survey that natural products businesses view this goal as a high priority, as many independent stores have hit on some profitable combinations of store size, product offerings, sales and expenditures.
This report will highlight some key findings from this year’s dataset, which reflects the July 1, 2013–June 30, 2014 time period. Keep your eyes open for our upcoming Web cast with more detailed analysis of this year’s survey data; it will be available on-demand at www.wholefoodsmagazine.com/multimedia in January.
A special thank you to all our readers who participated in this year’s survey; we sincerely appreciate you taking the time to submit your responses. Without your input, we could not provide this valuable analysis to our industry. Congratulations are in order for Grains and Greens in Michigan, which was selected at random from all our participants to receive this year’s $100 cash prize.
About the Survey
Each year, WholeFoods Magazine polls U.S. independent natural products retailers: privately held companies with one or more stores. This year’s survey reflects the operating results from such stores, representing over $900 million in gross sales and nearly 1.5 million square feet in gross lease area. Responses came from every region of the country and, in our view, represent a balanced snapshot of the universe of independent natural products retailers. For more, see the sidebar “Survey Participants."
The survey does not attempt to estimate the total size of the natural products industry. For that, we have asked Retail Insights’ president, Jay Jacobowitz, also WholeFoods merchandising editor, to provide you with his company’s annual “Retail Universe for Premium Natural, Organic Food, Supplement and Personal Care Sales,” which appears on page 35 and will be republished online. We are also grateful for his help in the compilation and analysis of this year’s data.


Sales Roundup
As in past surveys, WholeFoods Magazine breaks down our analysis by store type, based on how much perishable food a store sells. We believe that such products (including refrigerated and frozen foods, fresh produce and prepared foods) act as a magnet drawing shoppers into natural products stores on a frequent basis. A store’s size, sales and profit are directly affected by the percentage of perishables it sells, and we have divided these sales into five groups, to pinpoint real differences in operating results (percentages are of overall gross sales):
• 55+% perishables
• 35–54% perishables
• 20–34% perishables
• 10–19% perishables
• 0–9% perishables (≥5 locations)
• 0–9% perishables (<5 locations)
While the average of all stores in the survey is interesting, we ask readers to focus on the type of store most relevant to your operation: its size, product mix and percentage of perishables sales. In this way, you can best gauge how your store is doing relative to other natural products retailers most like you.
Let’s start the analysis with a broad stroke overview.
Overall, stores averaged $2,640,504 in sales, but there was huge variation among the store types, with the most perishables-heavy stores selling $13,886,653 over the survey period and the supplements-heavy stores with few locations selling $576,617 (see Figure 2). To illustrate this point another way, the median sales figure for all stores was $953,731—half of all stores had higher sales, and half had lower sales—well under the $2.6 million overall average (i.e., the mean), showing just how diverse the survey pool was. This year’s survey drew even more compact independent retailers than last year’s survey, and—a positive sign—the majority of the businesses in this year’s pack were very efficient and more profitable by the square-foot than in past years.
 As will be discussed more later, overall sales were correlated with perishables sales: the more the perishables sales, the higher the overall sales. One place where this trend did not hold was with the 10–19% group. The average sales for these stores was $915,705 for the year, less than the supplements stores with five or more locations ($982,412) and far below the next level of perishables stores. In fact, the 20–34% group had sales of $2,469,978, more than two-and-a-half times that of the 10–19% perishables group. The lower efficiency of the 10–19% group will be noted elsewhere in this analysis by other measures, too.
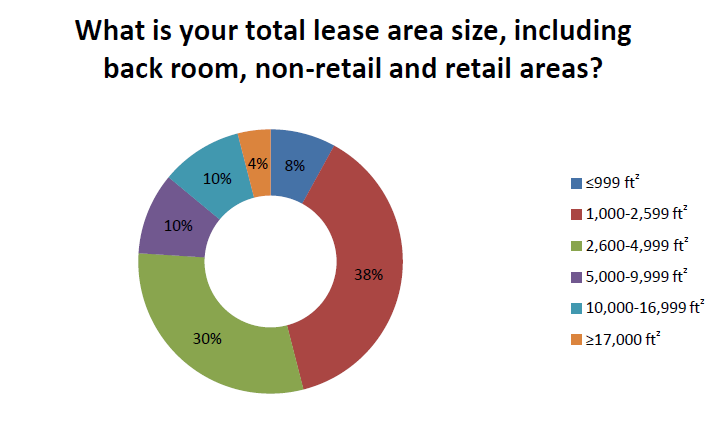
With this year’s survey pool (again, impacted by additional smaller retailers), average gross lease area (GLA) shifted slightly overall (4,511 ft2 in 2013 versus 4,321 ft2 GLA in 2014), as did average retailing area (3,421 ft2 in 2013 versus 3,295 ft2 retailing space in 2014). Of course, store size varied greatly by store type, with the highest perishables earners requiring the most square-footage (13,303 ft2 GLA on average for the 55+% perishables stores) and those with practically no perishables sales requiring the least space (1,533 ft2 GLA on average for the 0–9% perishables stores with less than five locations).
One small bump in the linear pattern of these data was the 0–9% ![]() perishables businesses with five or more stores. Consider these businesses the chains that focus on large volumes of dietary supplements sales. These stores had larger retailing footprints than the 10–19% perishables stores. While all stores used 24% of their lease area on backroom space on average (again, this varied by store type), the supplements chains devoted the smallest amount of their lease area to the backroom area (just 15%).
perishables businesses with five or more stores. Consider these businesses the chains that focus on large volumes of dietary supplements sales. These stores had larger retailing footprints than the 10–19% perishables stores. While all stores used 24% of their lease area on backroom space on average (again, this varied by store type), the supplements chains devoted the smallest amount of their lease area to the backroom area (just 15%).
Though this year’s stores were slightly smaller in size, consider how stores performed by the square foot. Annual sales per GLA square-foot jumped 41% this year (from $433 in 2013 to $611 in 2014). Likewise, we saw a spike in annual sales per retailing square-foot of 41% (from $567 to $801 in 2014). It seems that some very efficient smaller stores were in the mix. Independents that are weathering the storm of intense competition in the natural channel are competing with more compact footprints, where customer service can make an even bigger impact on sales.
The effect of perishables. Take a moment to look at the variation in sales by store type. While the average sales by retailing square foot was $801 for all stores, the 55% group had more than double those sales figures at $1,624 per retailing square foot. If you start with the smallest stores, sales increased in a nearly linear fashion right up to stores with the most perishables sales. Supplement chains with five or more stores had $444 per retailing square foot, and the supplements stores with less than five locations had $453 per retailing square foot. Similar trends were found in the sales per GLA square foot data (see Chart A).


Looking at overall sales by store type, we can see the diversity of the business models represented in this year’s survey, with the perishables-heavy stores generating the most sales and profits. Our survey base formed sort of a bowtie shape in terms of sales by product type (see Chart B). The strongest supplements sellers (by percentage of overall sales) sold the least perishables; vice versa, the top-selling perishables stores sold the least supplements (by percentage of overall sales).
It’s interesting to note the breaking point at which perishables sales become a positive factor for driving store sales, and when perishable offerings are perhaps not substantial enough to warrant bringing them in at all. The 20–34% perishables sales threshold may well be the point at which a store can begin to see the benefits of having fresh produce, prepared foods, and fairly substantial frozen and refrigerated goods in the store. This might be the level of commitment required from a store to meet the needs of a family doing a weekly stockup or picking up a quick dinner. This cements these stores in shoppers’ minds as potential weekly or daily shopping destinations. Adding meager perishables offerings into a mostly-supplements store likely won’t be enough to draw shoppers hoping to buy meals (or meal components) routinely from your store.
This effect can be tested when we look at foot traffic and average transaction amount by store type (see Figure 3). While average transaction dips the lowest for the 20–34% perishables group (down to $27.92 when the overall average was $31.56/transaction), those businesses are seeing above-average foot traffic (at 245 customers per day, while 203 customers per day is the average). Clearly, perishables is working to bring in additional daily shoppers.


Meanwhile, the 10–19% perishables stores have foot traffic that is much lower than the average, possibly because they’re playing in a “no man’s land” where there are not enough perishables to draw grocery shoppers in daily. The 10–19% stores had 97 customers per day with an average transaction of $29.75; those figures are close to the supplements stores with five or more locations, which averaged 90 customers per day and $30.32 per transaction. This supplements group, though, had higher gross and net profit percentages, as we’ll cover next.
While the 10–19% stores are efficient on the surface by another measure, customers per day by 1,000 ft2 GLA (see Chart C), there’s more to the picture. This group had about as many daily customers per thousand square-foot as the 20–34% perishables group (43 for the 20–34% group versus 44 for 10–19% group). Both were slightly under the overall average of 47 daily customers/1,000 ft2 GLA.
But there was a major difference in GLA between the groups. The 10–19% perishables group had a GLA of 2,206 ft2, while the 20–34% group had a GLA of 5,624 ft2 (Table 1). A similar increase was found in sales, as you may recall ($915,705 for the 10–19% group versus $2,469,978 for the 20–34% group). It is likely that the increase in perishables is also supporting the larger footprint and sales of the 20–34% stores.
This may be evidence that the 10–19% perishables group is just tacking perishables onto what is essentially a larger supplements focused store, and not a true fresh foods store. Clearly, there is a major breakpoint in store size between the 10–19% perishables group and lower perishables, and the 20–34% group and higher perishables. At this point, a supplements-focused format truly shifts to a fresh foods-focused format.


The Bottom Line
Sales are one thing; profit after all expenditures is another. The average gross profit margin (GPM) for all stores was 37.7%, for an average gross profit of $994,708. All store types had a fairly close GPM (as we saw in 2013). As was also true in 2013, the supplements-heavy stores were leading the pack in terms of gross profit percentage with numbers that were over 40%. The 10–19% perishables group was also on the high end at an even 40%. The 35–54% perishables group had the smallest GPM at 34.6% (see Figure 4).
The average net profit for all stores was $116,505, which was 4.41% of all sales. This number varied widely by store type, with the 55+% perishables group having the most net profit by dollar, but the lowest net profit percentage ($364,515 and 2.62%) and the 0–9% perishables stores with less than five locations having the least profit dollars yet the highest net profit percentage ($48,328 and 8.38%) (see Figure 5, Chart D).
Sales by Department
Overall, stores averaged $2,640,504 in sales, but let’s dig into those numbers department by department.
Perishables. Total perishables sales for all stores was nearly 41% of the overall sales average, accounting for $1.07 million per store on average. As we saw in the bowtie shape in Chart B, the amount of perishables sales varied greatly, from $25,809–$21,895 for the supplements-focused stores (2–3% of their overall sales) to $8,548,646 for the 55+% perishables group.
As noted in the analysis of the 10–19% group, these stores are sort of functioning more like a supplements store with a small amount of fresh food offerings. Indeed, the respondents in the group this year sold the lower end of the 10–19% perishables range at an average of 13.3% of their overall sales, or $121,529, from the perishables categories.
A look at the top-selling perishables categories for each group is also interesting:

The chart is organized by each group’s top-selling perishables categories. If you allow your eye to follow the path of Prepared Foods from left to right, you can see that the highest percentages of prepared foods sales are associated with the stores that sell the most perishables. A similar trend is found with Produce. This is more evidence that daily shoppers are bumping up sales in the larger grocers; they’re looking for ready-made meals or produce for use within the next few days.
At the same time, the 10–19% perishables stores attribute only 1.4% of their sales to prepared foods and 1.2% to produce. Refrigerated and Frozen Foods are their top perishables foods, perhaps serving the needs of a biweekly or monthly stock-up supplements shopper that picks up some frozen gluten-free bread while they are searching for probiotics in a refrigerator door. These stores are clearly more in supplements territory, with about half of their sales (on a percentage basis) coming from supplements.
The 20–34% group is interesting, too, because their perishables categories are about level across the board.
Shelf-stable foods. Rounding out the grocery areas, let’s talk about bulk foods and packaged dry foods. Stores took in about 6.2% of their sales from bulk. The supplements chains had practically no sales in this area while the 35–54% perishables stores led the pack at 10.6%.
For packaged foods, the 55% perishables stores sold the least of all the perishables stores on a percentage basis: 16.4%, which was under the overall average of 18.6%. Supplements chain stores dipped a toe in the grocery water, with 3.3% of their sales coming from dry goods, while the supplements stores with less than five locations attributed 11.5% of their sales to packaged foods.
HABA. Stores attributed about 6.2% of their overall sales to health and beauty aids (HABA), with the highest earners in the category being the 10–19% perishables group (10.8%) and the supplements stores with the fewest locations (8.8%).
Supplements. No surprise, the supplements chains earned the highest percentage of sales from this category, followed by the supplements stores with less than five locations. Perishables stores’ supplements sales (as a percentage of overall sales) declined in a linear fashion as perishables sales increased.
By the dollar, the most supplements sales came from the 55% perishables group ($966,612) followed by the supplements chains ($850,303).

Spending and Workforce
So what came out of sales to bring stores to their bottom lines?
Wholesale cost of goods averaged $1,645,816 this year (representing 62.3% of sales). Inventory is the biggest expense for retailers, and it differs greatly by store type. The 35–54% and the 20–34% perishables groups used more of their earnings on inventory than the average store in this year’s survey. Their inventory spending averaged $4,081,073 (65.4% of sales) and $1,560,702 (63.2% of sales), respectively.
The average inventory turns for all  stores was 11.58 this past year, which is right on par with last year’s average of 11.61 turns. No surprise, the heavy perishables sellers turned over their inventory much more frequently in 2014 than the average store in the survey. The 55% perishables group, for instance, had 19.24 turns in 2014, which is more than once every two-and-a-half weeks. Compare that with the smallest perishables stores with less than five locations. They turned over their inventory less than once every two months (5.51 times in 2014), which makes sense for a small supplements store. The larger supplements chains turned over their inventory more frequently: once every 43 days, totaling 8.67 turns in 2014 (see Figure 6).
Zeroing in on the other groups with below-average turns, the 10–19% perishables group had 7.06 turns. That’s only once every 52 days, which is probably not as frequently as a grocery-focused store would like to see. The next strongest perishables sellers—the 20–34% group—had one turn every 43 days. That’s exactly the same amount as the larger  supplements chains, showing just how efficiently these supplements stores are running.
Another large expense for stores was payroll. Annual labor costs averaged $436,138 (16.5% of overall sales), a slight decline compared to last year’s survey pool. As we saw in 2013, the supplements stores and the smallest perishables group had roughly the same number of full-time equivalent (FTE) employees, which was 4–5 FTEs, when the overall average was 18 FTEs.
The heavy perishables stores, with a larger footprint and more diverse staff needs such as bakers, produce managers and deli workers, had far more FTEs: 104 on average. They also paid the second-highest wages by hour, and had nearly $2.8 million in payroll costs (20.1% of overall sales).
Putting the data on an even playing field, we can look at stores’ FTEs per 1,000 ft2 and find an average of three FTEs per 1,000 ft2. Most store types came in right around this average, with the largest number of FTEs per 1,000 ft2 noted by the 55+% perishables group (7 FTEs/1,000 ft2) (see Figure 7).
There may, perhaps, be some evidence that owners of smaller stores are subsidizing their work force with their own efforts. Average sales per labor hour was $73.99. The breakdown by store type in Chart E illustrates that the smaller stores have the highest sales per labor hour, but they also had the lowest total compensation per hour ($9.88/hour, when the average total compensation per hour was $10.88 per hour).
Looking closely at average sales per labor hour in Chart E, there is a cluster within the 20–55+% perishables groups with sales per labor hour of $77.19, $70.95 and $68.33, respectively. The average for all stores with more than 20% perishables was $71.15. Sales productivity per labor hour jumps up dramatically beginning in the 10–19% group and continuing in the supplements groups at $85.76, $98.48 and $83.25. The average for all stores with 0–19% perishables was $90.27.


The higher-perishables stores (20+% perishables) also have more customers per day per 1,000 square feet, have higher gross sales per retail square foot, and higher gross sales per GLA square foot. Given this, it’s unlikely that higher-perishables are so much less efficient than stores with 0–19% perishables sales. Some inherent differences in the higher average unit prices of your typical supplements versus fresh-food purchases (think $20–30 bottles of vitamins versus $7.00 sandwiches) might account for some of the differences. It is also likely that the lower-perishables group is having at least some of its sales per labor hour subsidized by an owner operator(s) who is not on the clock or taking a wage.
Now, look at annual labor costs as a percentage of sales. Again, there’s a cluster in the 20–55+% perishables groups, with those stores spending 14.1% to 20.1% of their sales on labor, for an average of 17.3%. The 0–19% groups spent 11.8% to 12.6% of their sales on labor, with an average of 12.4% (see Table 4). Overall, there is nearly a five percentage point gap, with the 20–55+% stores paying 40% more compensation as a percentage of sales; more evidence that smaller supplements-focused and the smaller perishables stores’ owners are not giving themselves a salary on the books.
Another significant expense is marketing. Stores used an average of 1.6% of sales on marketing ($35,066). This varied greatly, as evidenced by the median annual marketing budget of $16,600 for all stores. Meanwhile, average annual rent was 3.94% of all sales ($104,157).
Future Prospects
Stores were asked to sum up their 2014 sales, and 61% reported growth (14% on average), more than we’ve seen in past years. A whopping 75% believe they will see a rise in sales in 2015 and about 10% are planning to expand their stores’ next year, possible signs of good things to come. WF


Notes on the 2015 Retail Universe
By Jay Jacobowitz, Founder and President of Retail Insights®
The natural products industry added a cool $5.05 billion in sales in 2014 and crested the 10% market-share threshold of total food-store sales for the first time as of 2015, at 10.23% or $63.05 billion of the $616.52 billion total food-store universe. Leading the way are the supernaturals such as Whole Foods Market and Sprouts Farmers Market, with a 29% share and $18.4 billion in sales, adding $2.1 billion in 2014 vs. 2013. Significantly further back in the pack, compact grocers—stores 20,000 ft2 or less—including Natural Grocers by Vitamin Cottage and Trader Joe’s, clocked in at 16.6% share, or $10.4 billion, adding $1.07 billion to their coffers in 2014.
Stretching their small lead over conventional  supermarkets, independent natural products retailers gained $817 million in 2014, for $10.19 billion in sales and a 16.2% share. This is remarkable because the sector actually lost 44 stores. However, average footprints increased from about 2,600 ft2 last year to about 3,200 ft2 this year, proving that independents are expanding their stores and remain a dynamic industry force.
Conventional supermarkets added $357 million in sales to tally $9.4 billion, with their share slipping to a 14.9%. None of the other four retail channels exceeds 6% share, but each of these club stores, mass merchandisers, pharmacies, and vitamin chain stores gained ground in 2014. Mass merchandisers grew by 11.2%, or $381 million, to $3.8 billion, driven mainly by Target’s expanding its food offerings in its traditional discount stores, and adding 147 of these units in 2014.
Overall, for the 110,622 retail stores selling natural and organic products in 2014, the average footprint reached 1,036 ft2 for natural products. Stores generated $569,992 in natural sales for the year, or $550 per GLA ft2 for natural products. There are 114.6 million total square feet dedicated to natural products in all eight channels of retail distribution, or 3.84% of the 2.98 billion ft2 devoted to U.S. food retailing. WF

Published in WholeFoods Magazine, December 2014